To ensure that you aren’t wasting time and budget on a marketing plan that isn’t working, you need to track essential marketing KPIs with marketing dashboards.
It's easy to get overwhelmed, though. Picking just a few yet important digital marketing KPIs to focus on can be difficult.
In today’s post, I’m going to cover which KPIs you can include, how to make one step-by-step, and some recommended tools to do so.
You can also skip down to:
What is a digital marketing dashboard?
A digital marketing dashboard is a way of consolidating data from multiple sources into a unified picture of your marketing performance.
Marketing KPIs are presented in a marketing dashboard with various graphs, charts, and lists (I’ll get into detail about that in the next section) and are a fundamental part of reporting.
There are hundreds of marketing KPIs out there and all of them are likely to have some degree of pertinence to your marketing initiatives. However, not all of them are helpful. It’s tricky to strike the right balance between being data-driven, and overwhelming yourself & your team with unnecessary tracking.
My advice is to focus on 1-3 core KPIs (for example, conversions, cost per conversion) by which you’ll make your major strategic decisions, and use additional metrics such as traffic, rankings, and clickthrough rate for smaller day-to-day optimizations.
16 KPIs to track with a digital marketing dashboard
Marketing KPIs can be categorized by channel. For example:
- General marketing KPIs
- Paid advertising
- SEO
- Email marketing
- Social media
I’ve compiled a list of 16 popular marketing KPIs to track. Let’s start with general digital marketing KPIs, before covering a couple of channel-specific ones.
1. Conversion rate
Conversion rate refers to any desired action that you want your users to take, which can be anything from a click on a button to making a purchase, a click on the ad, or signing up for something.
2. Cost per acquisition (CPA)
CPA is a metric that shows you the average cost to gain one new customer. Your cost per acquisition will depend on various variables, such as what your operating expenses or what you sell.
3. Return on investment (ROI)
Marketing ROI is a broad term that indicates how a business’s marketing efforts generate profit and revenue growth. A good marketing ROI is 5:1, meaning you get $5 for every $1 spent. Yet, an ROI will depend on factors such as the company’s overhead costs and margins.
4. Website traffic
Website traffic is measured in visits and is a common way to measure the website's effectiveness in attracting an audience. Although it isn't the most important web analytics metric, it's the one you start with when determining the overall effectiveness of your website.
5. Average time on page
The average time on page metric gives you a better idea of how effectively you engage your visitors throughout your website. It can help detect specific issues that need resolving, like poor website navigation or a lack of content.
6. New vs. returning visits
This metric is useful in understanding how many users you might potentially be attracting back to your website. Getting many new visitors is great since it means you're increasing brand exposure. Return visitors, on the other hand, are even more valuable due to the fact that returning visitors are much more likely to convert.
7. Organic search traffic
Organic search traffic refers to the visitors who land on your website as a result of unpaid or organic search results. The higher your website ranks for keywords related to your business, the more organic traffic you're going to drive.
8. Pages per session
This metric refers to the average number of website pages visited during a session. This is an engagement metric, showing you if your visitors found many pages engaging and easy to navigate.
9. Domain rating
Domain rating is a search engine concept that shows the strength of a given domain. Domain rating score comes from a machine learning algorithm’s predictions on how often Google is using that domain in its search results.
10. Cost per click
Cost per click or CPC is the amount advertisers pay for each click on their PPC ads on platforms such as Google Ads or Facebook Ads. The major goal is to lower the price of clicks while also attracting high-quality clicks.
11. Clickthrough rate (CTR)
CTR is a metric that quantifies the number of clicks marketers get on their ads per number of impressions. CTRs are a valuable way of comparing the performance of different advertising channels.
12. Email open rate
An email open rate indicates the number of subscribers that open up a particular email you send. This metric is a general indicator of subject line effectiveness, so high open rates mean your subject lines are attractive to readers to open the email.
13. Email click rate
Email click rate is the measure of the number of people clicking on a hyperlink, call-to-action, or image within a particular email. This KPI tells you if your campaign was appealing enough to entice an open and action from your audience.
14. Engagement rate
Engagement rate is the amount of interaction social content attracts, such as a comment, share, mention, or direct message, relative to other audience metrics.
15. Follower growth rate
Follower growth rate refers to the total number of new followers on your social media account over a particular time period. Tracking your follower growth as a metric helps you understand how many people engage with your content.
16. Social media mentions
Social media mentions indicate brand awareness and can give you invaluable insight into how engaged users are with your content and whether users like your product or service.
How to create a digital marketing dashboard in 30 minutes
To make a digital marketing dashboard, you’re going to need a tool. In this demonstration, I’m going to show you how to make a marketing dashboard with DashThis. That’s for 2 main reasons:
- DashThis is really easy to use. Much easier than Data Studio & other alternatives. You can connect & share all marketing data & KPIs from every channel in one place without any technical skills or experience.
- DashThis has great templates. You don’t need to build everything from scratch because DashThis gives you several options to start quickly from existing dashboard templates.
If you need further customization, you could consider a low-code app builder like Appsmith to make a dashboard & other internal reporting tools too.
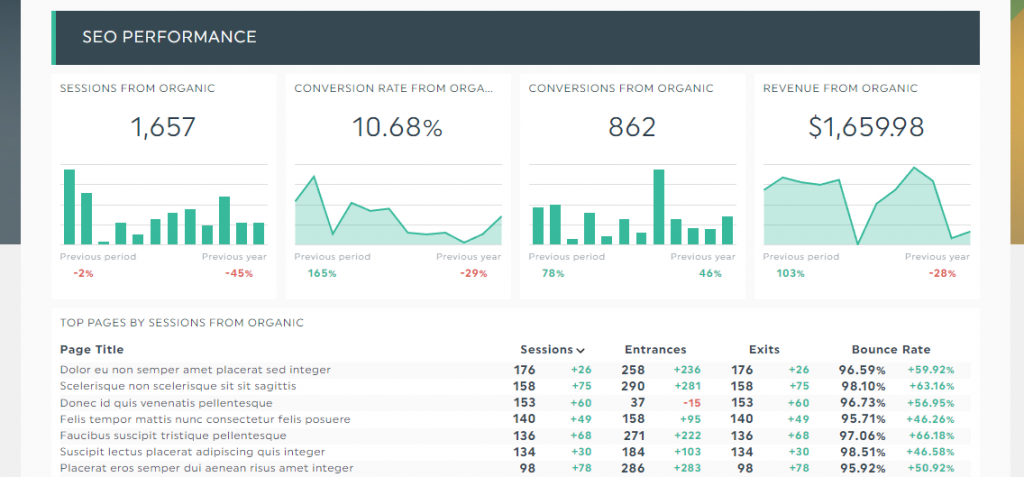
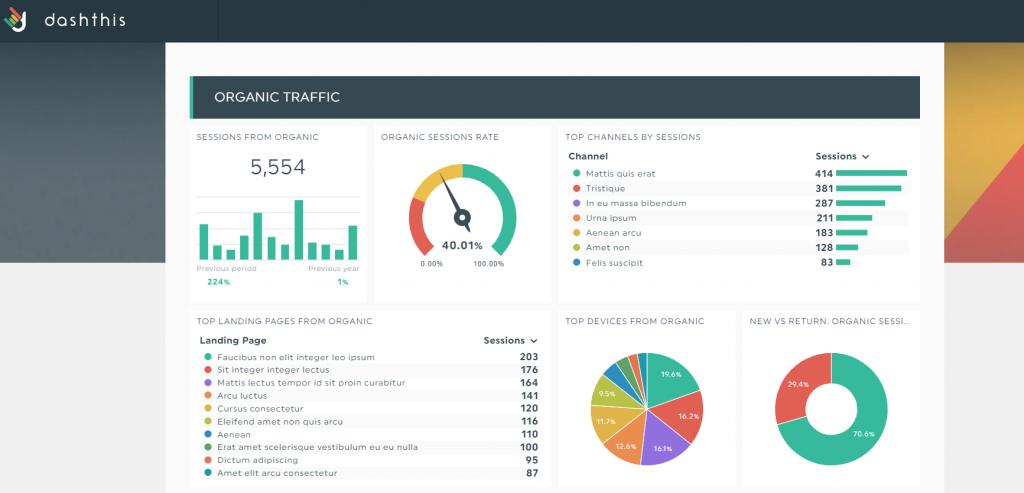
A digital marketing dashboard example
Once we’re finished, you can expect to have a digital marketing dashboard that looks & works something like this example. It will auto-update, and be shareable via a URL. Let’s start!
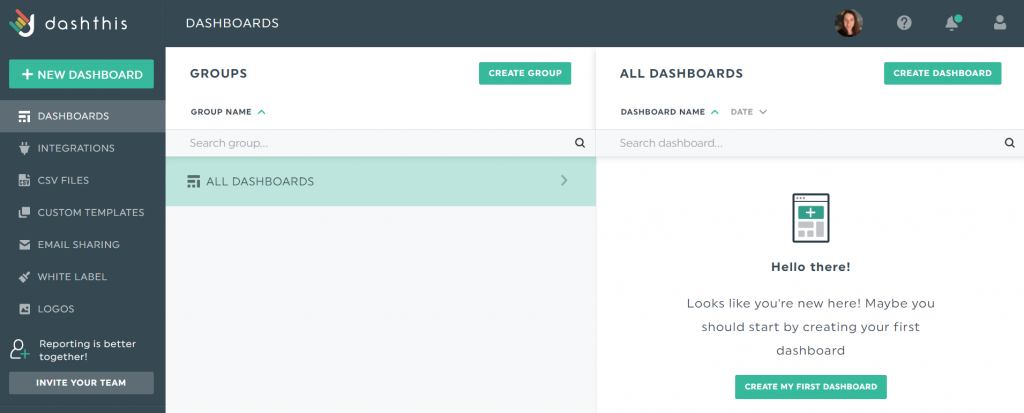
Step 1: Start a free trial
To get started, visit DashThis.com and create an account. There's a 15-day trial available. Once you've signed up, you should see the admin view.
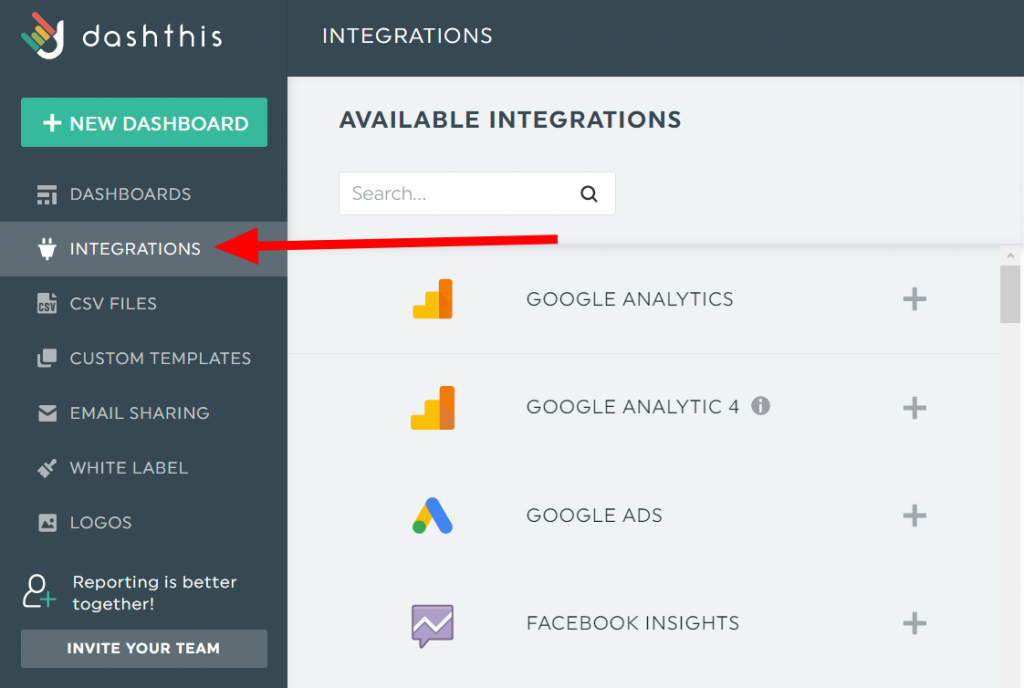
Step 2: Connect your data source(s)
Now, it's time to connect your data source. On the left side of the screen, you'll see Integrations. Click on it, and you'll see a long list of integrations DashThis supports. In this case, I'll connect with Google Analytics.
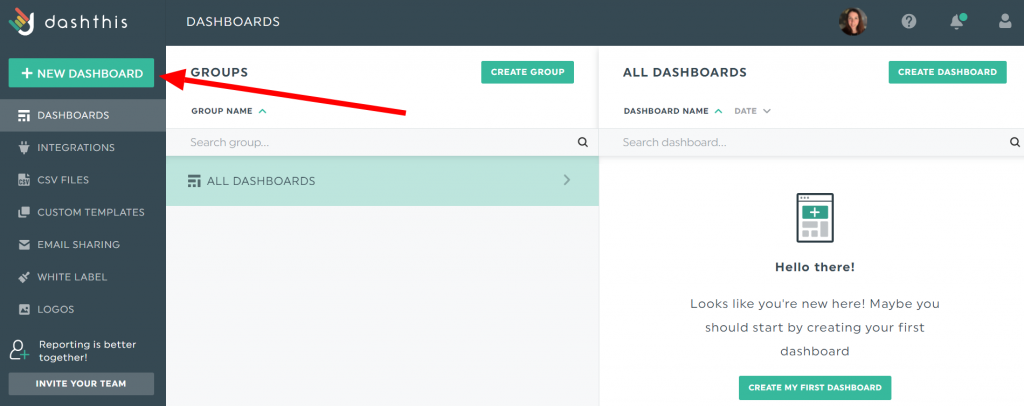
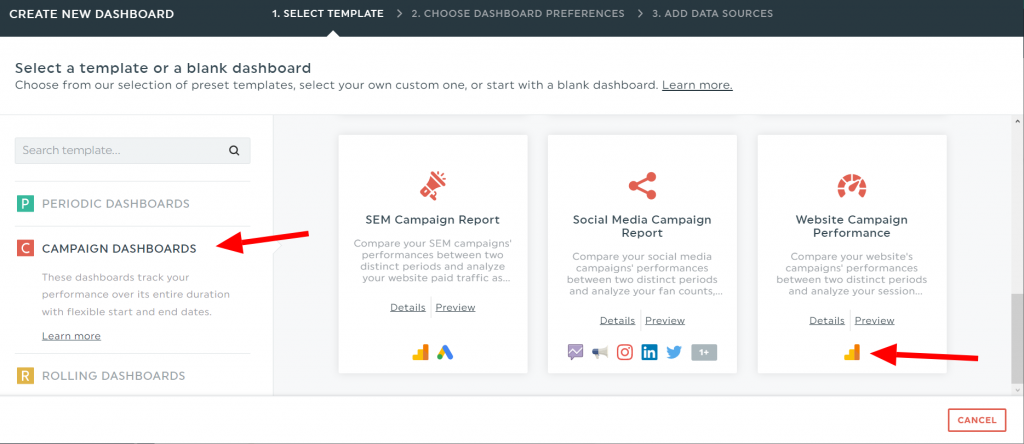
Step 3: Add a new dashboard
Now, we need to select a dashboard from pre-set templates, given that we’ll build on Google Analytics data.
DashThis offers 3 types of dashboards: periodic, campaign, and rolling dashboards.
Periodic dashboards provide reports based on daily, weekly, monthly, quarterly, or annual calendar periods. It also allows you to browse through past periods and is easily printable for record-keeping.
Campaign dashboards track your performance over its entire duration with flexible start and end dates. It also allows you to compare your current campaign to a previous one. No matter how long your advertising campaign rolls out – 1 week, 6 months, or 3 years – the campaign dashboard offers a great date range flexibility to monitor your overall performance.
Lastly, rolling dashboards measure your performance on an ongoing basis, including three specific date ranges. The goal of a rolling dashboard is to follow your performances repeatedly, validate the impact of your actions quickly, and observe tendencies.
I’ll go with a campaign dashboard to track the website campaign performance.
Step 4: Name your dashboard and set the dates
With your dashboard added, it’s time to give a name to your dashboard. Other fields you need to update are the campaign start date and campaign end date. I’m interested in seeing the website performance in April.
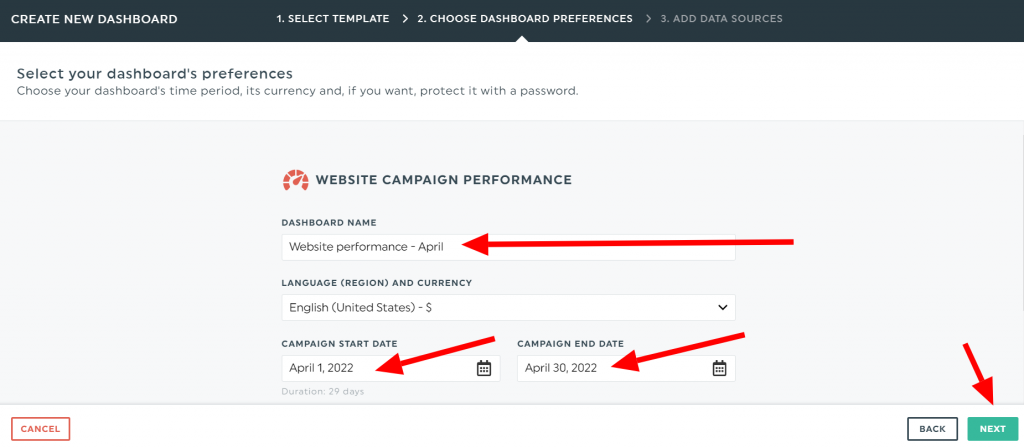
Click next, and you’ll need to add your data source.
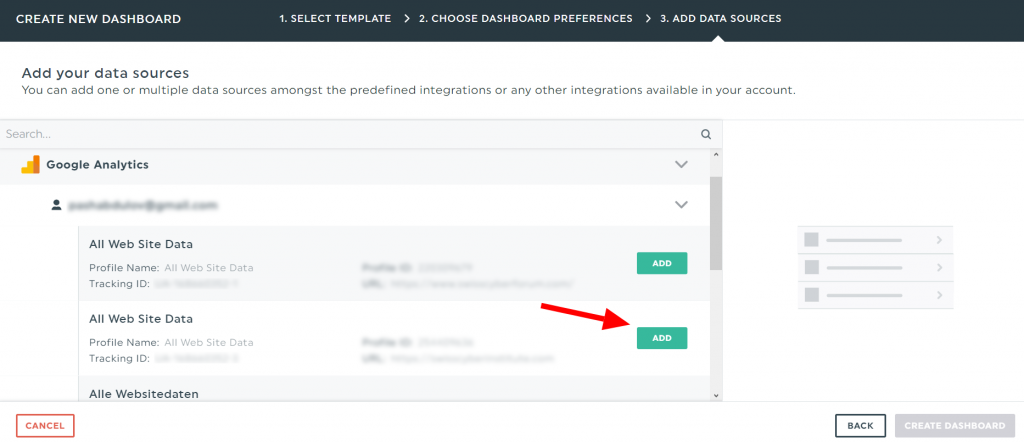
Step 5: Add your data source
Next, add your data source. DashThis allows you to add more than one data source amongst the predefined integrations or any other integrations available in your account. Locate your data source and click Add.
Step 6: Dive into the insights
It only takes a couple of seconds to build the dashboard without you needing to have any technical knowledge. It’d look like something like the below after you add your data source:
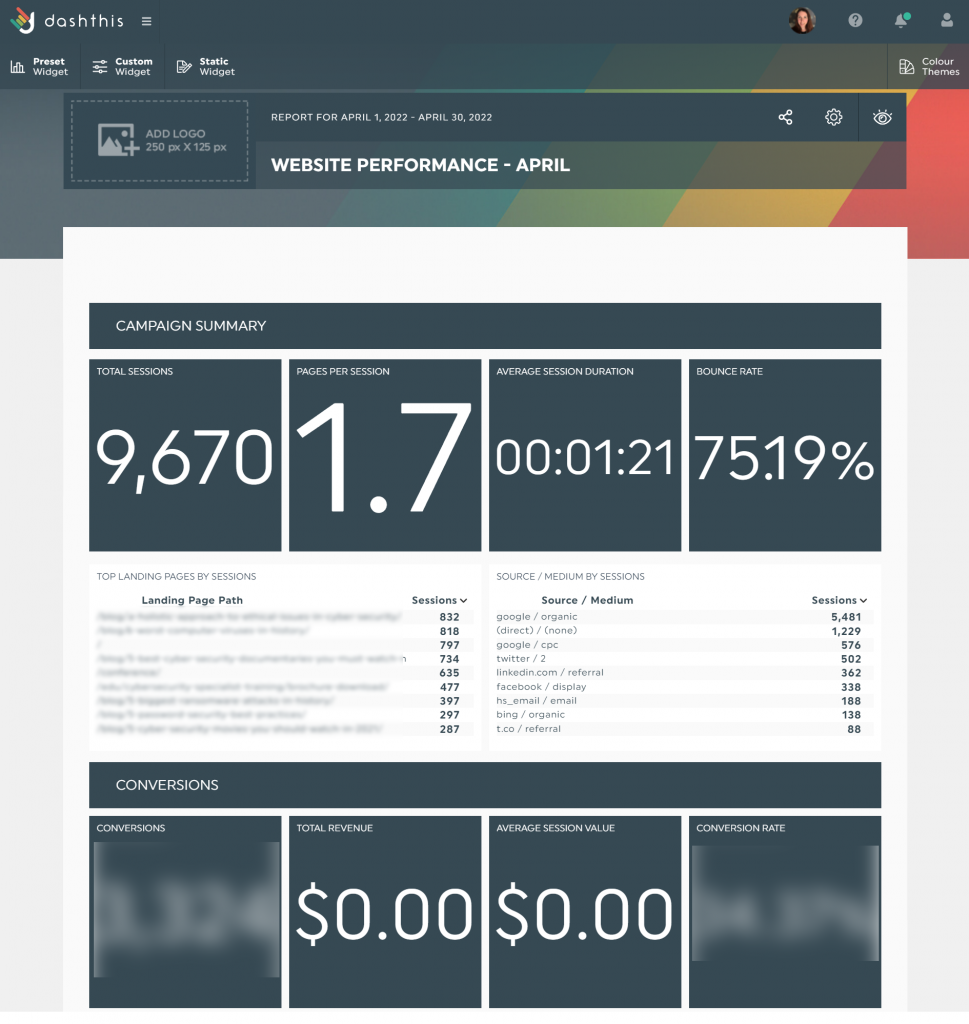
As you can see, this pre-set template is already loaded with important metrics like conversions, conversion rate, source/medium, and average session duration.
Step 7: Customize your dashboard
If you don’t see the metric you need, you can customize it via DashThis’s custom widget feature.
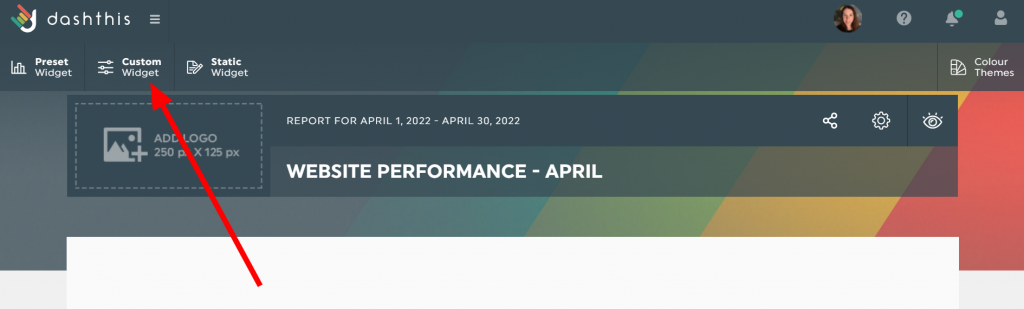
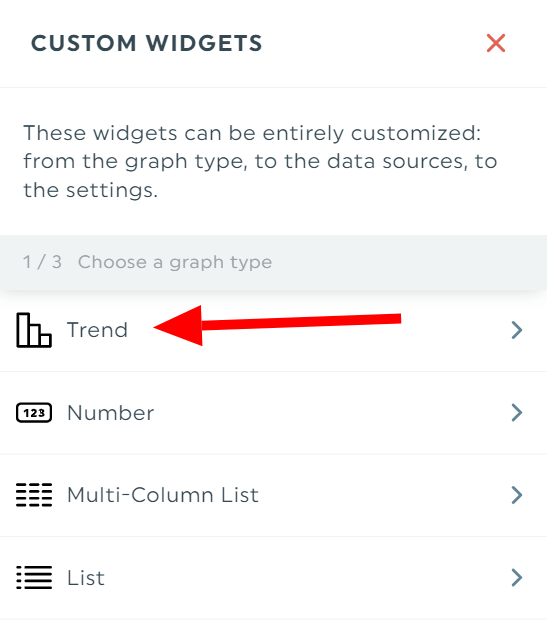
For example, let’s see the number of our Goal 1 Completions that have been generated through organic search traffic. To do that, click on the custom widget, then choose your graph type. Then, locate your data source again.
The next step is to choose your parameters, where I selected Goal 1 Completions as a metric and Organic traffic as a segment.
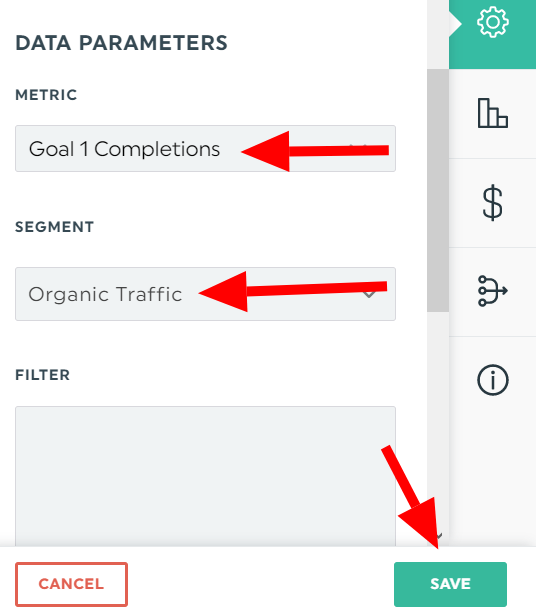
There you have it.
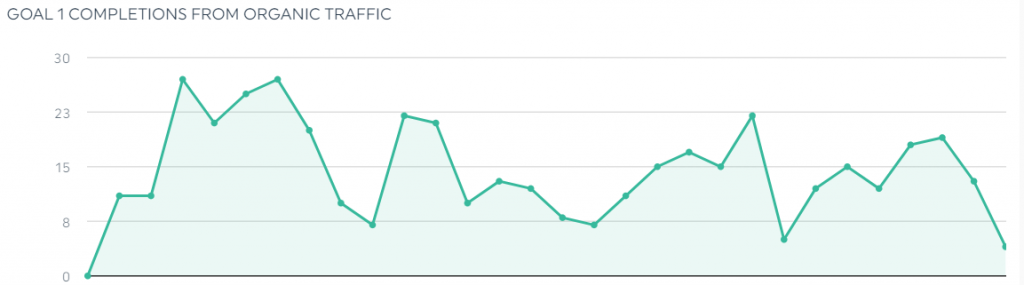
You can look through the pre-set widgets for quick insights or create your own custom widget, as I showed above.
From here, you have a useable (and shareable) digital marketing dashboard. Talk to your team, see what insights people want, and iterate over time.
5 best digital marketing dashboard tools
The process above uses DashThis, but it isn't the only tool for the job. Here's 5 digital marketing dashboard tools that perform similar functions, each with their own pros & cons.
I think DashThis is the best option for marketing dashboards, but it doesn't have a free version (prices start from $33/month). If you have zero budget, and/or you need a broader scope than just marketing, try Google Data Studio, Databox, or Klipfolio (these all have free versions).
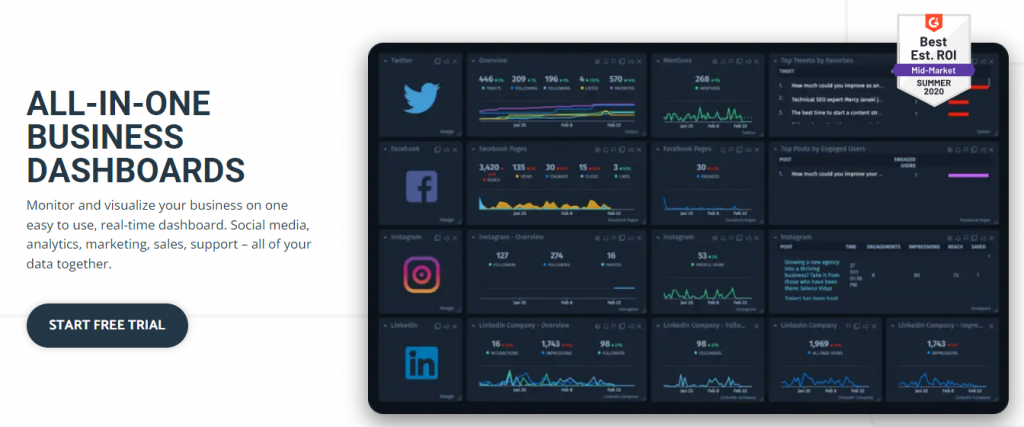
1. DashThis
DashThis is a powerful marketing dashboard tool that aggregates key marketing KPIs from different sources. The biggest strength of DashThis is that it’s so easy to use. Here are some of its nifty features:
- Integrations with over 35 marketing tools, including Google Analytics and Search Console, Facebook Ads, Linkedin Ads, Semrush, and Ahrefs
- Multiple integrations in the same dashboard
- 50+ pre-built report templates
- Unlimited users (on every pricing plan)
- Drag and drop dashboard editor
- White-labeled dashboards and custom color themes
- Link sharing and PDF export
If you want to give DashThis a spin, I recommend trying the free trial with their general digital marketing dashboard template. It's the fastest way to get a taste for whether or not it fits your needs. You can customize/iterate later.
Free trial: yes, 15 days. Sign up here.
Starting price: from $33/month
2. Klipfolio
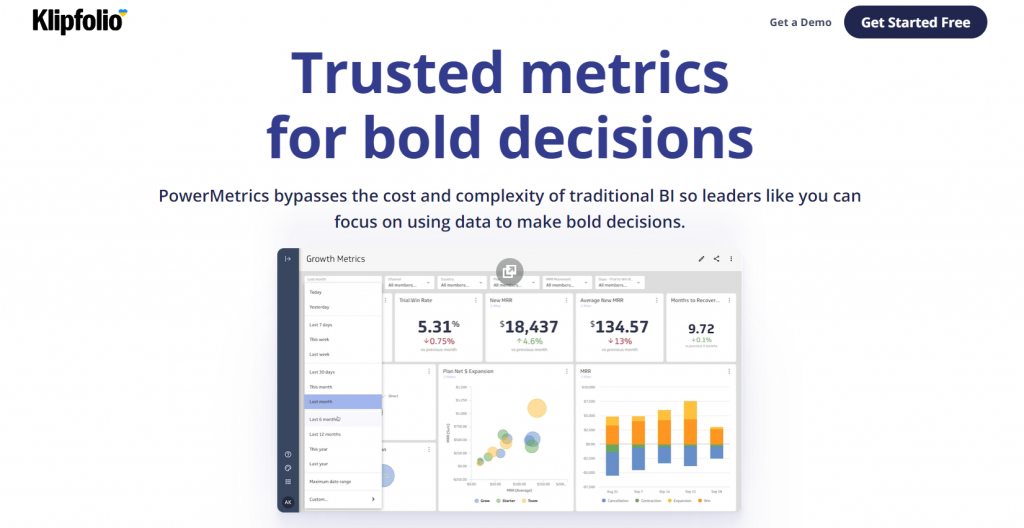
Klipfolio is a reporting and dashboard software that offers extensive pre-built visualizations, real-time dashboards, agency solutions, and data-source connectors for different databases. Here are some Klipfolio features:
- 100+ data connectors (Google Analytics and Search Console, Facebook ads, Twitter ads, Hubspot, Mailchimp, Semrush)
- Automated reports
- Dashboard templates
- Data sharing and collaboration
- Client management
- PDF export
Free trial: offers freemium version. Sign up here.
Starting price: from $99/month
3. Google Data Studio
Google Data Studio is a free tool to pool the marketing information together in one place and visualize it. It’s not so intuitive to set up like DashThis, but if you're generally tech-savvy, it’ll be simple to get started. Below are some of the Google Data Studio features:
- Over 400 integrations (some are paid)
- Fully customizable dashboards
- Drill-down capabilities
- Automated reports with real-time data
- Calculated fields
- Real-time collaboration
- Report delivery schedule
- PDF/Excel exports and link sharing
Google Data Studio is totally free to use. Sign up here.
4. Databox
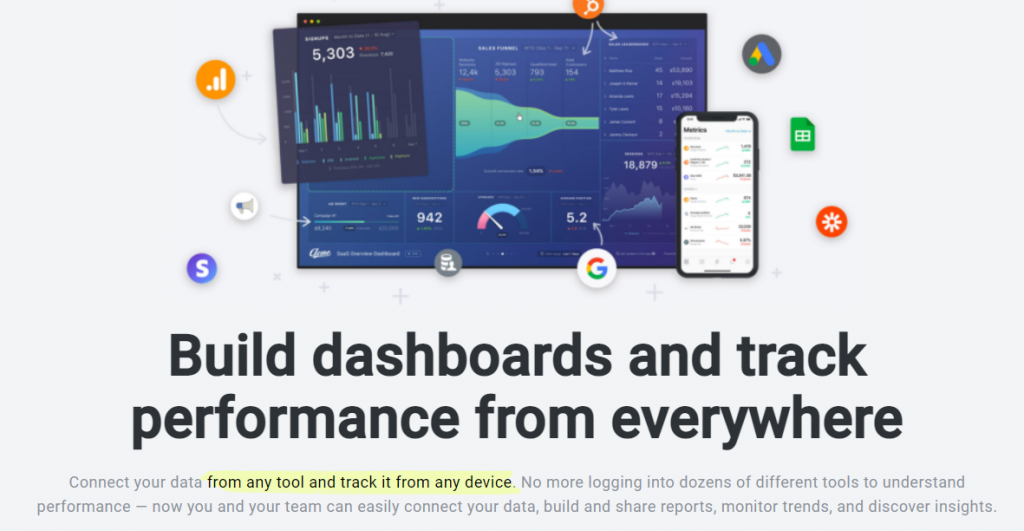
Databox is a dashboard solution that aggregates marketing data from multiple sources, giving you a holistic view of your marketing performance. Some noteworthy Databox features include:
- 200+ free marketing dashboard templates
- 70+ integrations (Google Analytics and Search Console, HubSpot, Mailchimp, Semrush, Ahrefs, Moz)
- SQL database integration
- White-labeled dashboards
- Calculated metrics
- Automated dashboards
- Alerts and notifications
Free trial: yes. Sign up here
Starting price: from $72/month (+$250 for white label features)
5. Cyfe
Cyfe is a comprehensive dashboard solution for analyzing and reporting data from different marketing channels such as SEO, pay-per-click marketing, email marketing, web analytics, and social media. Key Cyfe features are:
- An extensive list of chart types, including cohort, Gantt, gauge, and multi-chart
- White-labeled dashboards and custom themes
- 100+ integrations (Google Analytics and Search Console, Google ads, Google Sheets, Google ads, Linkedin ads)
- Dashboard templates
- Unlimited data exports
- Client management
- Single sign-on or SSO authentication
Free trial: yes, 14 days. Sign up here.
Starting price: from $19/month
Now, it’s your turn
Tracking the essential KPIs can help you assess the overall performance of your digital marketing activities, regardless of whatever marketing channel you use. Which of these marketing metrics have you been tracking, and is there any metric you think I must add to the list? Leave your thoughts in the comment section.