Attribution models lie, but revenue doesn't. Having a revenue dashboard to check in on key growth metrics is the perfect source of truth for any starting or scaling company.
Setting one up can be done pretty quickly, since it's mostly just about connecting data from one place to another.
To create one, you have a few options. They are:
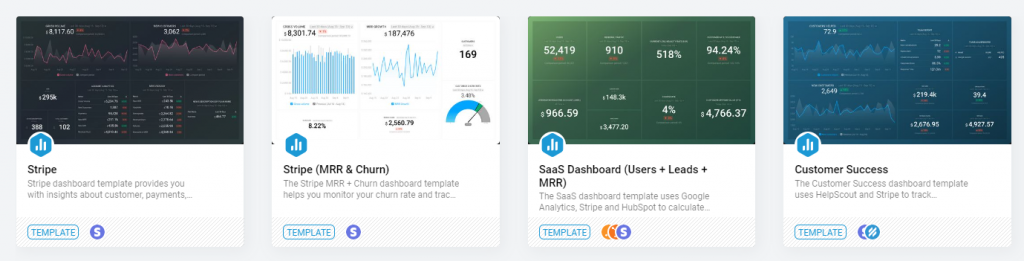
- Use a KPI dashboard tool (like Databox)
- Use a subscription analytics platform (like Baremetrics)
- Use your payment processor (like Stripe)
Once in place, these dashboards will help you analyze revenue trends, and answer questions about company performance.
1. Use a KPI dashboard tool
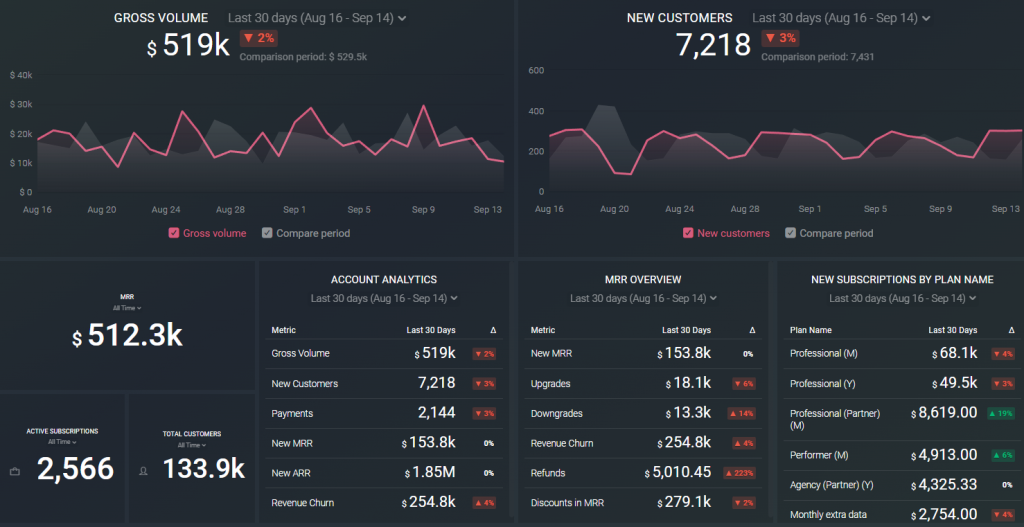
A KPI dashboard tool like Databox let's you pull all your data together in one place. It has integrations with:
- All your marketing & sales tools
- Your payment tools like Stripe & PayPal
- Financial tools like Quickbooks & Xero
- CRMs like HubSpot
You can also create SQL dashboards.
That means you can avoid the chaos of multiple analytics tools, and keep everything in one place.
It's quite straightforward. In Databox, all you need to do is choose a data source (e.g. Stripe or Xero), and choose from the pre-made templates. After that, you can use the drag-and-drop UI to customize, without any technical skills.
There's even a free-forever plan, and they even offer free setup for your first dashboard(s).
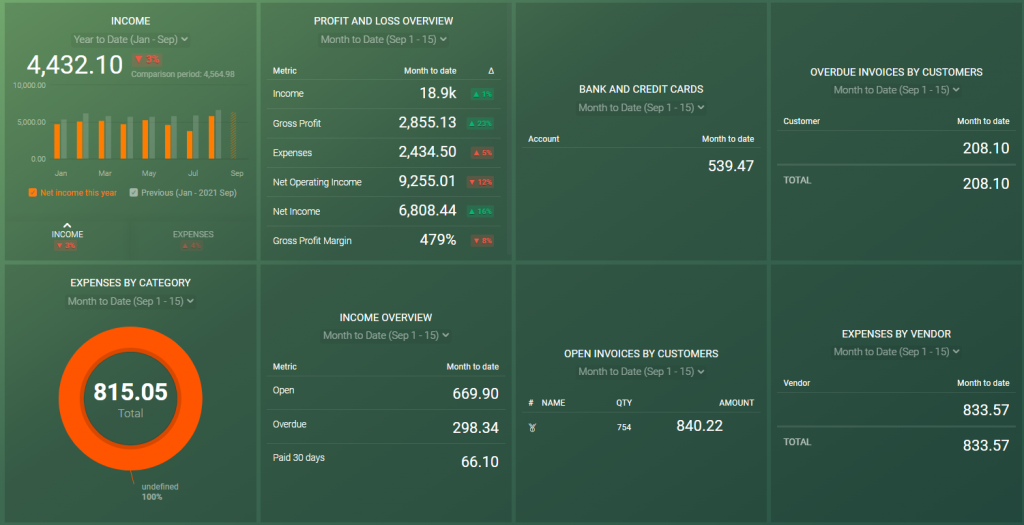
Here's one more example/template for a Quickbooks profit & loss dashboard:
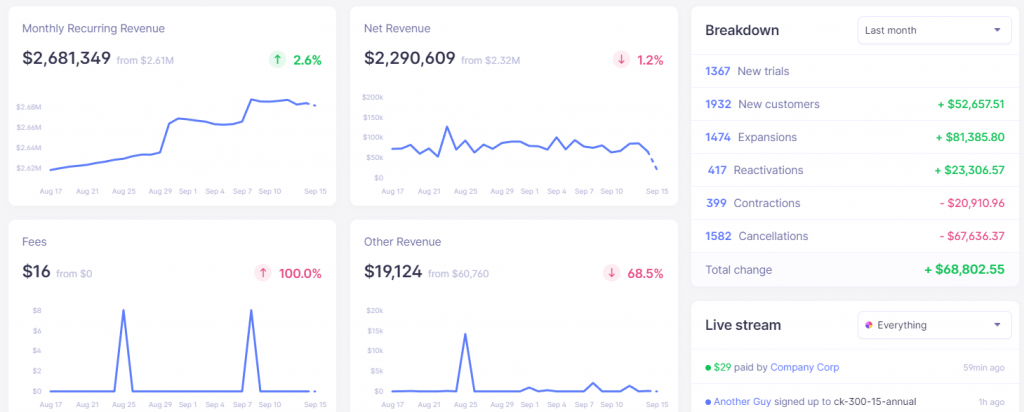
2. Use a subscription analytics platform
Like the name suggests, this method is relevant for SaaS subscription businesses.
Revenue tracking platforms like Baremetrics (or ChartMogul, Profitwell, etc.) connect to your payment provider and adds additional functionality on top:
- Data analysis
- Data cleaning
- Data exporting
- A nicer UI
- (etc.)
Typically, these tools also solve problems with data accuracy. For example, in Stripe, your trial users could be counted as a part of total customers or revenue. With a platform like this (built specifically for SaaS revenue), those situations are handled better.
It's also a better way to share revenue insights with your team, vs. granting everyone access to Stripe data directly.
Baremetrics in particular also has addition features for things like cancellation insights, dunning emails, and more.
Since Baremetrics allows it's users to ‘build in public', or share public information, you can easily find more examples. Here's a SaaS revenue dashboard example that ConvertKit makes publicly available: https://convertkit.baremetrics.com/
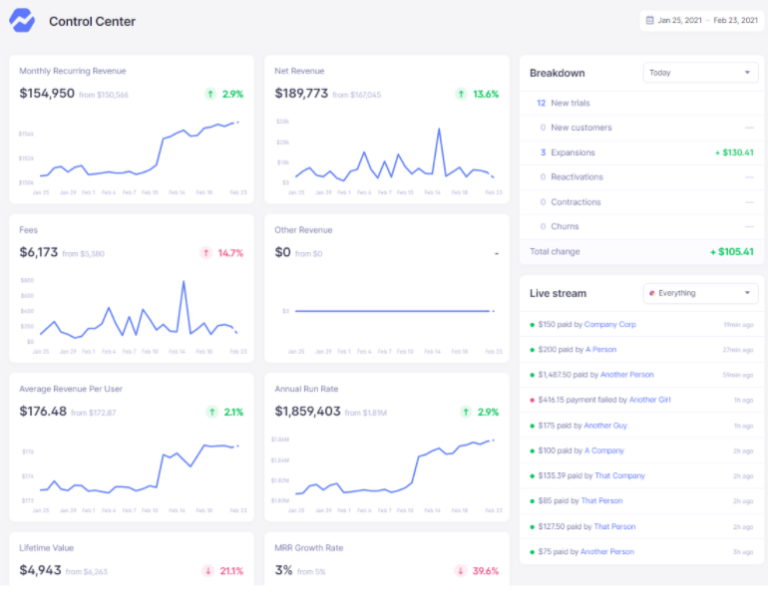
3. Use your payments processor
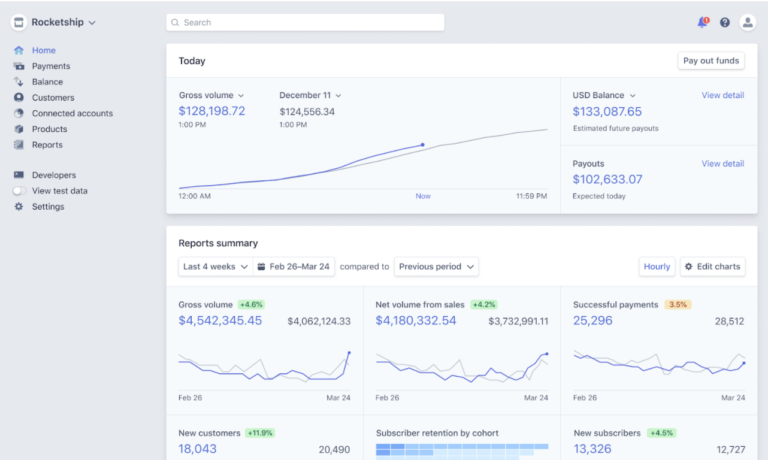
This method might rank last in terms of effectiveness & functionality, but it is easier (and free) compared to adding an additional tool.
Your payments processor likely has a base level of revenue analysis included already. For example if you're using Stripe, you will already be able to answer questions like:
- “How many new customers did we acquire last month?”
- “What is our monthly revenue growth rate?”
- “What was the volume of payments received this month?”
Built-in revenue dashboards from Stripe & other processors are a pretty good place to start. Extra tools do add more value, like automated reporting, and data cleaning, analysis, and exports mentioned above.
What to include in a revenue dashboard
Whichever method you pick, there's a few common fundamentals that you'll want to see on your revenue dashboard. The exact revenue metrics will depend on your business model, but here's a few universal ones to look for:
- Total customers
- New customers
- Total revenue
- Average revenue per customer
- Expansion revenue
- Average customer lifetime value
- Trial-to-paid rate
- Churn rate (gross & net)
- Reactivation revenue
Best practices
Here's a few practical tips for using a revenue dashboard within your organization.
1. Keep it clean. It's easy to get carried away adding hundreds of metrics. Figure out what are the most important ones, and make them easy to understand.
2. Make it accessible. Generate a shareable link, and make sure all the key stakeholders can view the dashboard any time. This builds transparency, and reduces questions asked.
3. Consider security. When sharing sensitive company data, check the permissions. Especially if you're sharing a URL. Most tools will allow you to share only with specific people, or those in your org (identified by email domain, for example).