Dashboard tools can be hard to choose. They require a little effort to get setup, and it can be a pain to switch down the line if you make the wrong choice.
I've tested Databox and Klipfolio; both fantastic tools in this space. They have notable differences, however. I'll help you to understand when/why it makes sense to choose each in this comparison.
Let's start with the main differences between Databox and Klipfolio summarized!
The difference between Databox vs Klipfolio
The main difference between Databox and Klipfolio is that Databox is generally easier to use, offering more templates & design options, but Klipfolio offers more flexbility, advanced analytics , and data modeling.
For an average marketing or sales team looking for a user-friendly dashboard tool that's quick to use, Databox is a good bet.
For teams with more technical data & development resources, Klipfolio allows for more advanced customization, catering for very specific data/reporting requirements.
| Reasons to choose Databox: | Reasons to choose Klipfolio: |
| Easier to use for non-technical people | More native integrations & API |
| Data stories (better automated reporting) | Enables more advanced analytics & data modeling |
| Faster support responses & free setup assistance | Allows more flexibility for specific needs |
| More templates & dashboard design options | |
| Try Databox for free | Try Klipfolio for free |
Here's a few other comments elaborating on key differences that might matter to you.
- Databox has more ready-made templates. They're also available in-app, whereas Klipfolio's have to be accessed via the website. If you want an out-of-the-box solution to work quickly, it's a big advantage. No-code design options are better too.
- Klipfolio has more native integrations. Databox has 70+ one-click, native integrations, and others can be made via SQL, spreadsheets, or Zapier. Klipfolio has API & Zapier too, but has 300+ native integrations.
- Databox has faster customer support. With Klipfolio, you can pay separately for a Data Hero plan to get extensive hands-on support. Without that, you're relying on submitting tickets. Databox have a well-staffed live chat, and proactively reach out to offer setup assistance.
Comparing Databox vs Klipfolio
Let's compare the features, pricing, and other decision-making factors to help you pick between Databox and Klipfolio. We'll look at:
- Creating & sharing dashboards
- Customer support
- Agency features
- Pricing
- Time to implementation
Creating & sharing dashboards
1. Dashboards
Summary: Databox has better pre-built templates & no-code design options, while Klipfolio allows more customization for technical teams with HTML/CSS/JavaScript.
Databox
Databox dashboards are easy to build.
The template library is a big selling point for Databox. There's 200+ ready-made templates, which cuts down a lot on implementation time. They cover marketing, sales, support, finance, and several other use cases.
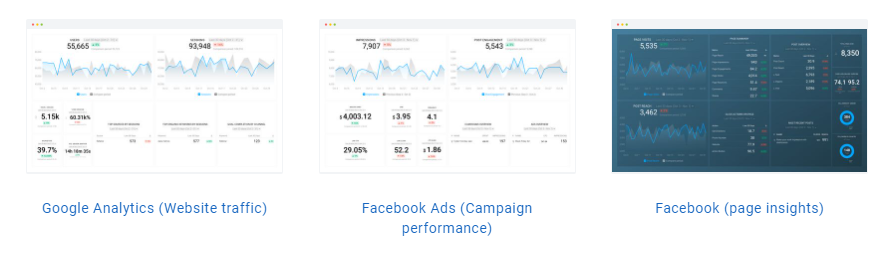
You can customize the templates, or start from scratch. There's a drag-and-drop editor that is straightforward to use — just pick a metric, and drag it into your report. No coding or design skills required.
Klipfolio
Klipfolio's platform has two different parts: Klips and PowerMetrics.
Klips provide a platform for custom dashboards building and distribution — this is where Klipfolio excels.
The Klip Editor uses a rich, built-in library of formulas, filters, and functions to streamline complex data; you can filter, group, aggregate, and sort it as needed.
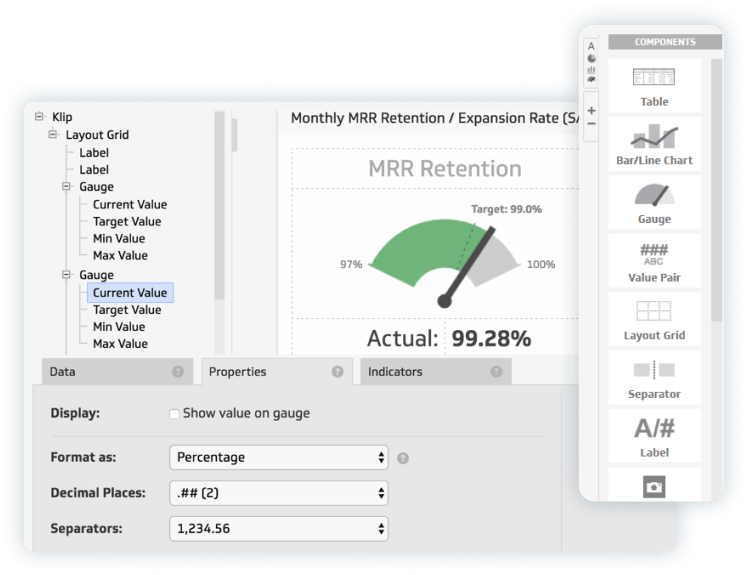
Dashboards can be customized further with HTML, CSS, and JavaScript — something that isn't possible in Databox.
With PowerMetrics, you can build self-serve dashboards for teams with the following features:
- Instant metrics
- Dashboard templates
- Design customizations: colored labels, branding, company logo
2. Data visualizations
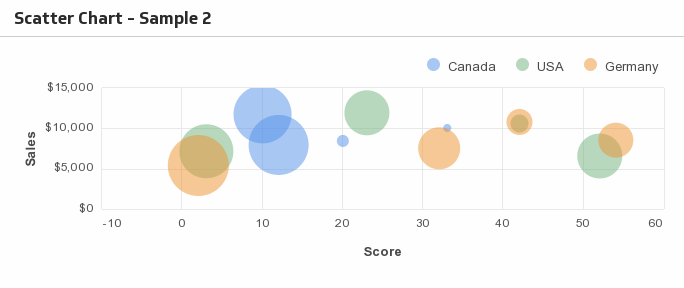
Summary: Both tools cover all the major visualizations, but Klipfolio more options overall (e.g. scatter charts, pictograph). In Klipfolio you also have more flexibility over the look and feel of charts.
No matter the tool you choose, both Klipfolio and Databox cover the basic visualization types. But, depending on your use case, you might require different charts to satisfy your reporting needs. Here are some visualizations you can find in both Klipfolio and Databox:
- Numbers
- Line graphs
- Bar graphs
- Pie charts
- Tables
- Funnels
There are a few differences, which might be relevant depending on your use case.
Databox
Visualizations which are available in Databox, but not Klipfolio are:
- Progress bars
- Leaderboards
- Pipeline visualizations

Klipfolio
Klipfolio offers a wide range of visualization types, which are fully customizable. Using the Klip Editor, you can easily adjust the chart type to define your axis, font style, chart layout, padding, and more.
Visualizations which are available in Klipfolio, but not Databox are:
- Scatter chart
- Radar chart
- Tree map
- News
- Map
- Pictograph
- Separator
- Layout grid
3. Metrics (calculated, custom, and basic)
Summary: Both tools allow pre-built metrics, custom metrics, and calculated metrics. Databox makes this easier to do, without connecting a spreadsheet or database, and no coding.
Databox
Basic metrics
Both Databox and Klipfolio offer a range of pre-built metrics. These metrics are there to facilitate your ability to build custom dashboards as they combine a metric with a visualization type. Nothing noteworthy to mention there.
Custom metrics
If you are looking to include filters, dimensions, and segments in your data, both tools allow you to create custom metrics. An example, you might want to report on ‘mobile-only link clicks from X & Y Facebook Ad campaigns.
With Klipfolio, you can use Klips Editor to specify the data points you want to add to your chart. However, it’s a little less beginner-friendly. Generally, your data will get pulled from any database into a spreadsheet format, which you can then manipulate and customize to fit your needs.
In Databox, there's a dedicated feature for this called Query Builder. It doesn't work for every data source, but it does work for most popular use cases like ad platforms, CRMs (e.g. HubSpot), Sheets/Excel, SQL, and others. That makes it possible to create Custom Metrics directly within the UI, with no coding necessary.
Calculated metrics
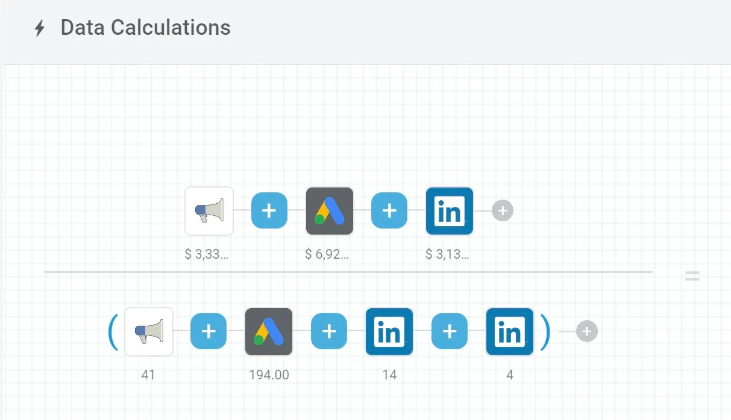
Both tools also offer functions for calculated metrics, which allow you to combine any existing metric, through an equation, to make a new one. As an example, you might want to report on ‘Total Ad Spend which includes Google Ads and Facebook Ads cost’
Both Databox and PowerMetrics allow you to easily create calculated metrics.
4. Sharing options
Summary: Both tools offer similar sharing options. Databox allows you to embed your dashboards on a web page. In Klipfolio, you can embed a Klip via HTML, but not an entire dashboard.
Databox
Databox’s dashboards are very responsive. They can be accessed via desktop, TV, mobile and even on your Apple watch. You can share your dashboards by:
- Copying a shareable link
- Sending via email
- Sending via Slack
- Embeding dashboards on a web page
- Streaming dashboards on a TV
Klipfolio
Klipfolio has similar sharing options to Databox, these include:
- Shareable links
- Slack integrations
- Emailing dashboards
- Displaying on a TV
- Embedding Klips
The major differences are that you can't stream directly to a TV (though you can get around this, e.g. by connecting a laptop), and you can't embed a whole dashboard into a web page.
Customer support
Summary: Both tools offer basic support with priority support available at a higher price. Databox offers in-app live chat support for a quicker response time.
Databox provides live in-app support, and a dedicated customer support team. Priority Support add-on is available for all paid plans: it grants users one hour of phone support monthly and moves your ticket to the top of chat and email support queues.
Klipfolio lets you create a ticket via Help Centre or Support Team — Business plan users get priority support. The other way to resolve the issues is by looking them up on the community forum, or knowledge base, or taking a look at the recorded webinars and YouTube videos.
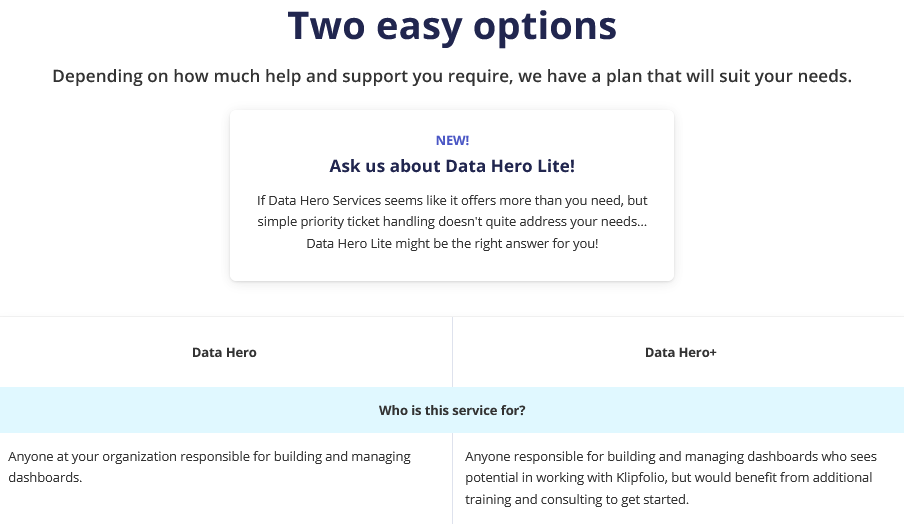
Data Hero services are available separately for everyone having custom support needs, with interactive sessions for design, setup, architecture, and more.
Agency features
Summary: Both tools offer Agency features to facilitate client management. Klipfolio offers more extensive client account setup options. Databox facilitates internal account reviews, and it can also automate additional written reporting.
If you are a digital marketing agency, both Databox and Klipfolio offer a wide range of features to facilitate client management & reporting. Let’s take a look at these in more detail:
Databox
In Databox, you are able to create client accounts to secure all of your client's data in one place. Agencies are able to:
- Easily switch between client accounts
- Manage user access for each client account
- Use ‘master’ account templates
Databox offers the Performance Overview Screen, which allows agencies to view all of the client’s top metrics and goals in one place. This is a great feature because it eliminates the work required for an internal account review as you can quickly check performance and goal achievement per client.
And, while it isn't only an agency feature, their reporting tool is very handy for agencies. It speeds up written reports & presentations.
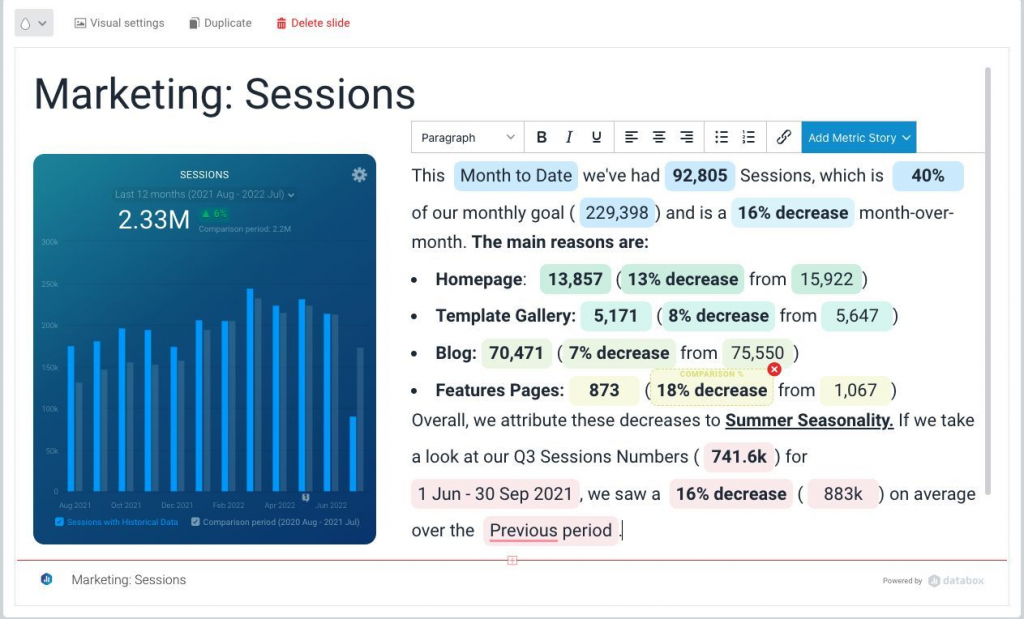
Since Databox has all of your data sources connected, it can help you to automate written highlights such as:
• [This month] we got [# signups], which is [%] of our goal.
• [Traffic] increased by [%] from [#] to [#].
• Between [date range] we saw a [%] increase in [close rate].
Learn more about the feature here.
Klipfolio
Klipfolio has similar agency features to Databox, but, it offers more flexibility with the set up. When setting up a client account you can:
- Define the account status (selecting the setup or trial mode means the client account will not be considered operational and will be excluded from billing)
- Select features you want to enable in each client account
- Indicate how the client account will be billed
Similar to Databox, you can switch between client accounts, manage user access per client and use master templates.
Pricing
Summary: Both tools can provide free KPI dashboard software. Klipfolio's free version is a little more extensive. Paid plans start at $72/month for Databox, and $99/month for Klipfolio.
Databox
Databox has a Free-forever plan that provides the users with:
- All of the standard Databox features;
- 3 data source connections;
- More than 60 integrations.
There are 3 paid plans available, starting at $72/month:
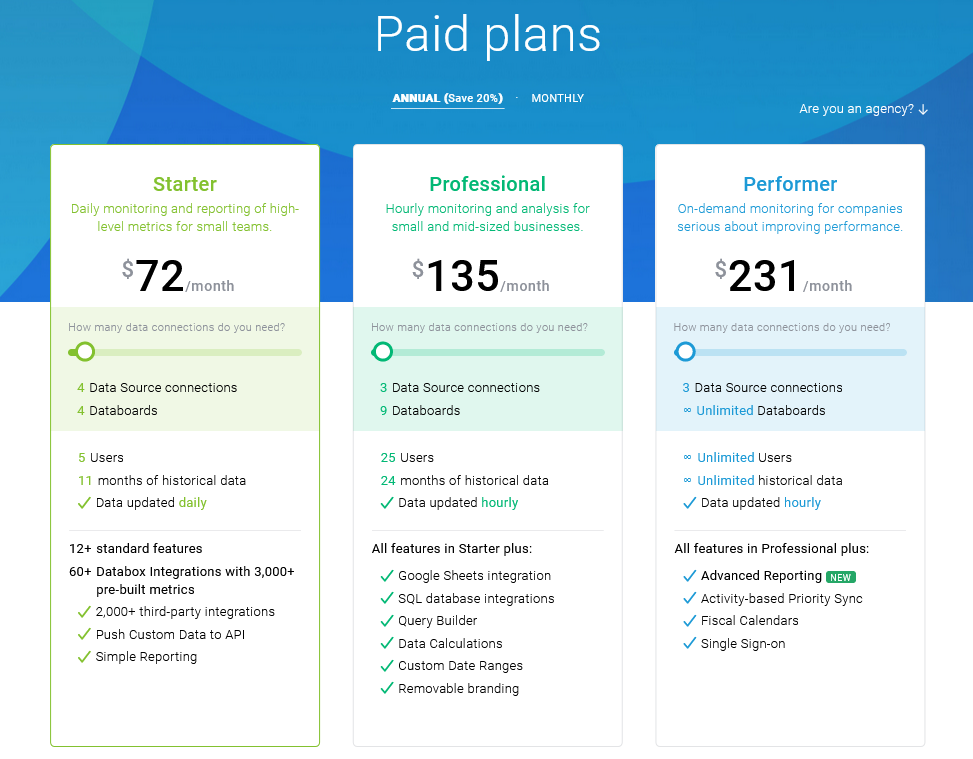
Branding & White-labeling add-on is available for $250/month.
Databox also offers a 15-day free trial that will allow you to explore advanced reporting features included in the paid plans, no credit card info is required.
Klipfolio
Klipfolio also offers a free-forever plan under the PowerMetrics platform. The free plan includes:
- Unlimited metrics, dashboards, and viewer users
- 2 editor users, 3 data services, 5 dimensions
- Up to 2-month data range window
- 4-hour data refresh
Paid plans start at $99/month, and there are 3 tiers:
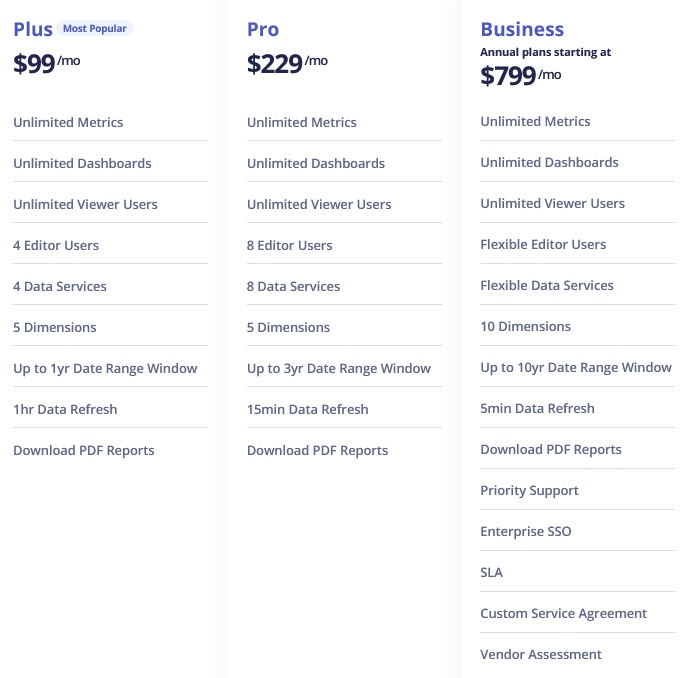
Klipfolio provides several white-labeling services, priced separately:
- Branding+ — $299/month to remove all Klipfolio branding;
- SSL Domain Alias — $99/month to use your domain name;
- Custom Theme — $99/month to upload custom CSS and JavaScript.
Klipfolio offers a 14-day free trial, no credit card required.
Time to implementation
Now that we have taken a deep dive into each feature, let’s review how long it might take new users to get started.
Disclaimer: obviously, the actual time is going to vary. These are just averages/estimates. Overall, for most standard use cases, Databox makes things slightly quicker.
| Phase | Databox | Klipfolio |
| Making your first dashboard (from a template) | Time: ≈ 5 min 200+ dashboard templates that come pre-built with common metrics and KPIs across all departments. Dashboards are easily accessible in-app and can be filtered by data source and category/function. | Time: ≈ 8-10 min 60+ dashboard templates for executives, sales, marketing, and social media. Dashboards are accessed through the website and are grouped by category. No dashboard filtering available for templates. |
| Making a custom dashboard (design + calculated metrics) | Time: ≈ 20- 30 min Drag and drop pre-built metrics to the dashboard, or build custom metrics using the query builder (no coding). Calculate new metrics with simple equations (no coding) Select from a range of pre-defined chart and dashboard themes. Dashboard Wizard automatically pairs a metric with the right visualization type to speed things up. | Time: ≈ 30 – 50 mins May take a little longer to set up a custom dashboard., because the Klip Editor can be difficult to navigate. It requires some time investment to understand its capabilities but provides advanced customization options which makes it worth it in the end for certain needs. With Klipfolio you can also: Access pre-built Klip templates for popular services, create calculated metrics using a simple equation (PowerMetrics only), update the layout of the dashboard. |
| Done-for-you service | Time: ≈ 30 min Use the live chat in Databox to request custom dashboards for any integration. Depending on your needs dashboards could be delivered live in chat within 30 minutes. For more complex requests, their support team deliver dashboards within 72 hours (free). | Time: 2-4 hours The Data Hero add-on is an additional service that you can purchase interactive sessions with the support team. Even though it’s not technically a ‘done for you service’ this service puts you face-to-face with product experts who will help you build your dashboards from scratch. This includes 1) dashboard design, architecture, setup, best practices, 2) Build data sources and visualizations, 3) Understand Klipfolio concepts like dynamic data sets and formulas, 4) Navigating 3rd party APIs & API coaching, and 5) Wire-framing for dashboard design |
Final thoughts
Klipfolio is an advanced, expert data tool. Complex features and formulas it uses can gather and transform the data in a myriad of ways, which requires some backend and data knowledge. Once you get ahead of the learning curve, there’s few things it can’t do on its own, or powered by numerous integrations.
Databox is easier to use than Klipfolio. The platform doesn’t require any coding knowledge, for any feature it provides: every functionality is intuitive and you won’t need onboarding courses to figure it out. Databox team is ready to help get you started with custom dashboard fast, for free. Feature list is above-average, and capabilities are well-rounded to service businesses of all sizes, empowering them to harness the power of data to grow.