In this article, I’m going to give you an in-depth look at the 11 KPI dashboard solutions available on the market today in 2024 – all for free.
Let’s dive in.
Here are the top 11 free KPI dashboard software
- Databox
- Klipfolio
- Google Analytics
- Google Data Studio
- Microsoft Power BI
- Google Sheets
- Mixpanel
- Tableau
- GoodData
- Zoho Analytics
- Amplitude
Scroll down to get the details of each tool.
1. Databox
Best suited for: quick KPI dashboard setup with one-click data connections and templates
Starting price: Free, with paid plans from $72/month
Key features
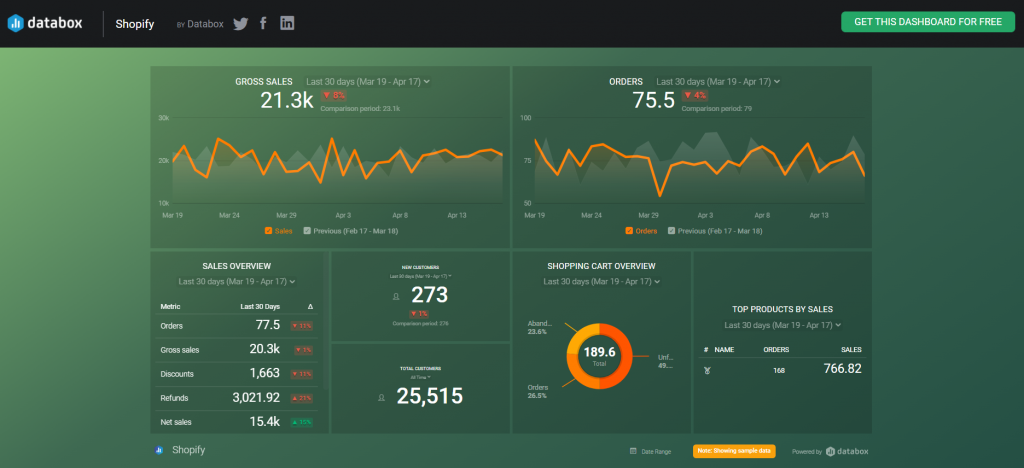
Databox is a KPI dashboard tool that makes it easy to visualize & share all kinds of data. It has a generous free-forever version.
The UI is simple to use, and there are plenty of templates to get started quickly.
You can connect your data without any technical skills using 70+ one-click integrations. Some of these integrations include Google Analytics, Google Search Console, Hubspot, Facebook ads, Google ads, Semrush, Ahrefs, Zapier, and many more.
Databox lets users create reports using its report templates and it has over 200 report templates you can choose from. It comes with a drag-and-drop feature that allows you to quickly design dashboards that can be refreshed at predetermined intervals.
Databox can also provide white label dashboards, but that feature isn't available in the free version.
Pricing
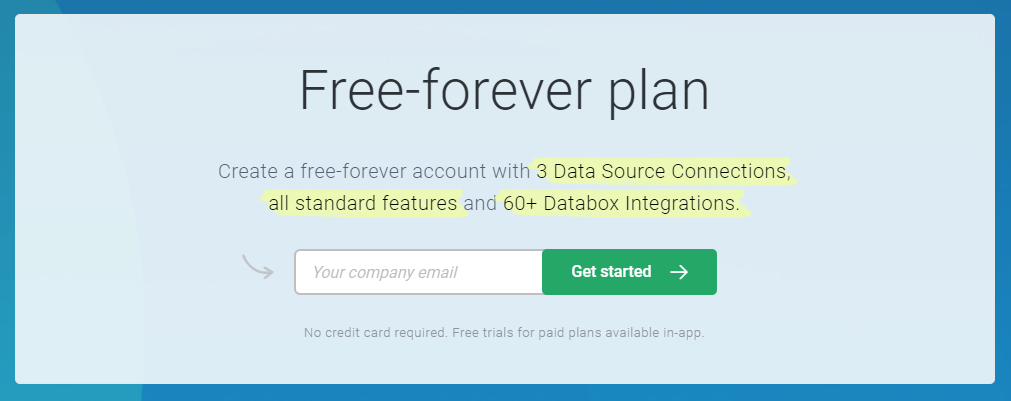
Databox comes with 4 plans: Free, Starter, Professional, and Performer. The ‘Free’ plan is limited to only 3 data source connections only. See full pricing here.
2. Klipfolio
Best suited for: marketers looking for a free out-of-the-box KPI dashboard
Starting price: free, with paid plans from $99/month
Key features
Klipfolio is a KPI dashboard software with a free version available. You can use it to visualize data from different sources (with one-click integrations) in a dashboard that automatically updates.
To start with, building complex dashboards to track many metrics throughout your whole metrics collection is so simple with Klipfolio. With its plug-and-play system, any integration is manageable without requiring any coding at all. Some of the data sources Klipfolio syncs with are Facebook/Google ads, Google Analytics/Search Console, Shopify, and HubSpot.
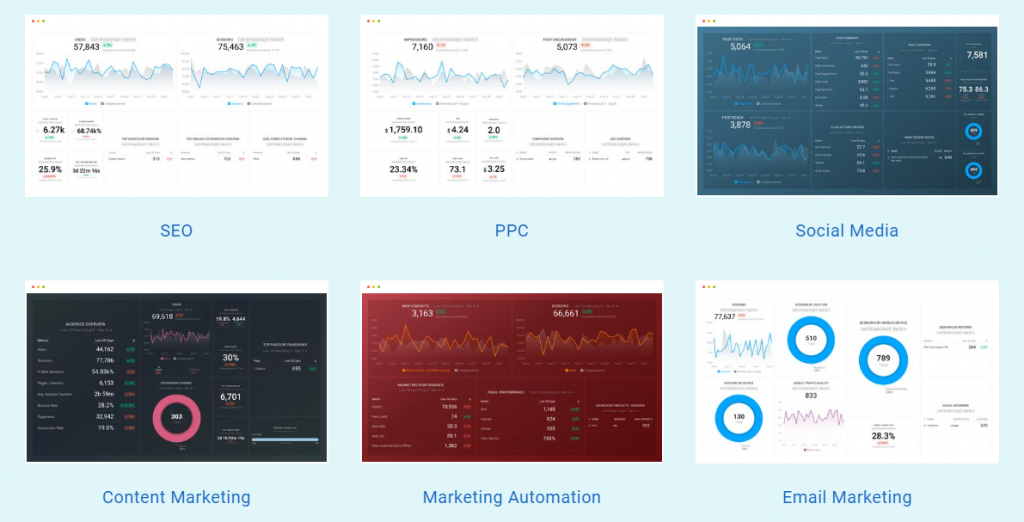
Secondly, Klipfolio comes with a variety of dashboard templates – for Google Analytics, Facebook ads, SEO, and content marketing – that can be used as a starting point for your dashboards.
Klipfolio has a separate product for client management that’s called Klips. With that, you can easily white-label your Klipfolio dashboard so your clients will see your company logo and branding when they log in to view their metrics.
Other Klipfolio features are:
- Alerts & notifications
- Report sharing and collaboration
- Real-time analytics
- Multiple access permission levels
- ETL capability
- PDF exports
Pricing
Klipfolio’s free plan offers unlimited metrics and dashboards with a 4-hour data refresh interval. View full pricing here.
3. Google Analytics
Best suited for: digital marketers who need to get better insights into the full value of their marketing campaigns
Starting price: free
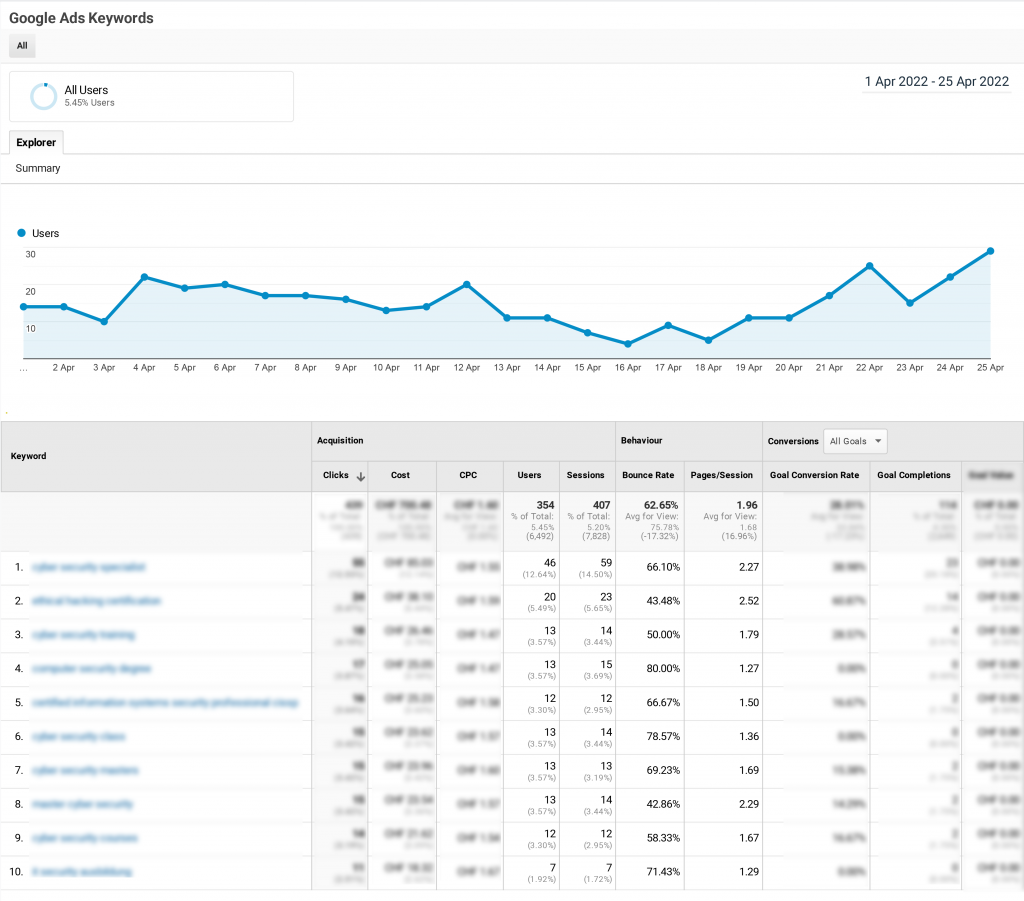
Key features
Google Analytics allows you to track and analyze the performance of your website and visitors from all referrers, including search engines, social networks, PPC networks, and direct visits.
Several types of reports are available within Google Analytics which include audience reports, advertising reports, acquisition reports, behavior reports, and conversion reports.
It’s very easy to collect and manage data with Google Analytics through tools such as collection APIs, tag management support, custom variables, and data import. Furthermore, this feature allows for adding custom variables like custom dimensions, custom metrics, and calculated metrics.
Last but not least, Google Analytics lets you integrate seamlessly with other Google solutions, which comes in handy in keeping track of all your activity and data through a single location.
Some essential Google Analytics features are:
- Funnel analysis
- Conversion tracking
- Calculated metrics
- Google Analytics API
- Custom alerts
- Data import
Pricing
You can use Google Analytics for free. Its paid plan – Google Analytics 360 – starts from $12.500 per month or $150.000 per year.
4. Google Looker Studio
Best suited for: marketers and business owners who need a free reporting and dashboard solution, especially those using Google's ecosystem
Starting price: free
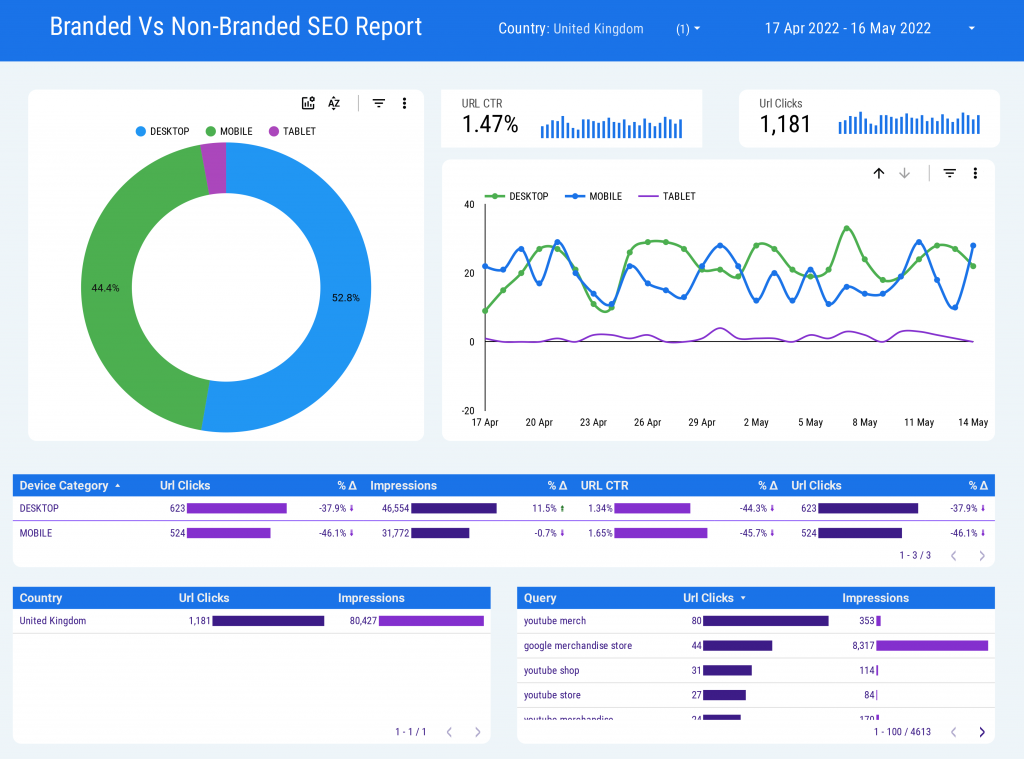
Key features
Google Looker Studio is a reporting solution to pull data together & create insightful dashboards. With Google Data Studio, you have over 300 partner integrations at your disposal (some of these integrations are paid).
Google Data Studio is loaded with over 33 variations on different visualization types to select from – everything from basic bar charts and scorecards to time series and geo maps.
It allows you to create new calculated fields through various functions. The syntax is based on SQL and if you’re already familiar with SQL, you must find writing formulas fairly simple.
Publishing reports in Google Data Studio is so easy – you can add people to your report via their email address or name if they’re in your organization, and you define what permissions they have.
Other useful Google Data Studio features are:
- Drill-down capabilities
- Conditional formatting
- Calculated fields
- PDF or Excel exports
- Shareable dashboards
- Real-time collaboration
- Add images by URL
Pricing
Google Looker Studio is a free product. You can sign up here.
5. Microsoft Power BI
Best suited for: finance, operations, marketing, and sales teams who need to quickly filter and view granular data sets with easily configurable reporting figures
Starting price: from $9.99/month
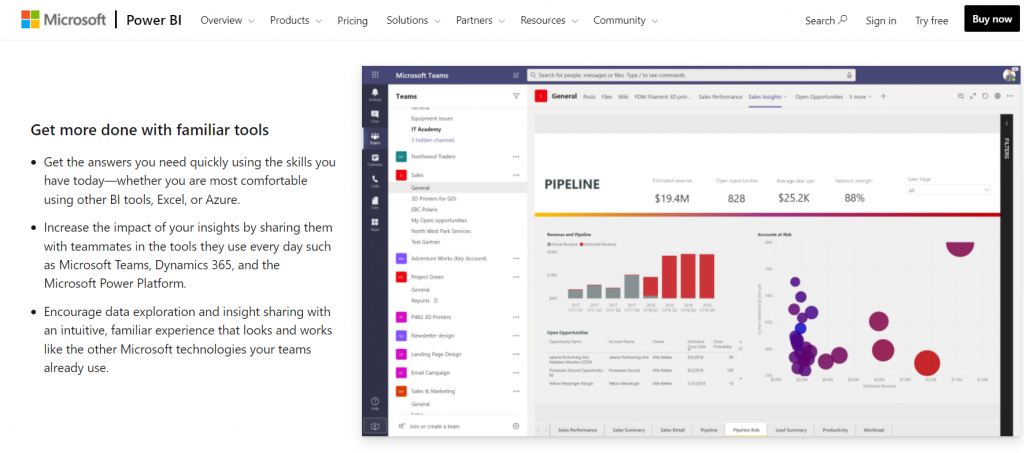
Key features
Microsoft Power BI is a business intelligence and data visualization software to monitor important organizational metrics in an interactive way.
It’s easy to set up and supports many data sources to connect to. The key file data sources it connects with include Excel, Text/CSV, XML, JSON, and PDF. You can also import data from many online data sources, such as Google Analytics, LinkedIn Sales Navigator, Zendesk, Asana, Salesforce, and many more.
One of the biggest strengths of Power BI is that its Q&A feature allows you to explore your data in your own words using natural language. Power BI Q&A is free and available to all users.
Other key Power BI features are:
- Automatic data refreshes
- Collaborative framework
- Dataset filtration
- Power BI mobile app
Pricing
Power BI pricing starts from $9.99/month and the starting plan gives you access to over 100 data sources and a mobile app. See full pricing here.
6. Google Sheets
Best suited for: anybody who needs a basic solution to store data, track KPIs and create dashboards and reports
Starting price: free
Key features
I'll assume you already know what Google Sheets is (an online Excel alternative).
One of the most useful features of Google Sheets is updating spreadsheets collaboratively in real-time. Instead of sending spreadsheets over email, a single document can be accessed and modified by multiple individuals simultaneously.
Another beautiful Google Sheets feature is that you can embed spreadsheets onto web pages or blogs, thanks to its embedding capabilities.
Other Google Sheets features are:
- Offline editing
- Conditional formatting
- Add-ons and templates
Here are some Google Sheets templates for KPI monitoring:
Pricing
Google Sheets is completely free to use.
7. Mixpanel
Best suited for: product teams needing to monitor product usage KPIs
Starting price: free up to 100k MTUs, then from $25/month
Key features
Mixpanel is a product analytics solution that allows you to visualize the data, build funnels, and see top user flows without any technical knowledge. Mixpanel allows up to 100k monthly tracked users for free.
It’s a great tool to analyze your product usage in detail. In that way, you can see how often users perform meaningful actions, track the growth of key user cohorts, and understand how current trends compare to previous results.
Mixpanel dashboards are easy to customize and the data updates in real-time, so your teammates can make decisions with the latest numbers. With its alert feature, you can control when you're notified by selecting the reports to monitor and the thresholds that trigger alerts.
Some extra features Mixpanel offers include:
- Predictive analytics
- Geotargeting
- Website analytics
Pricing
Mixpanel pricing starts from $25 per month (billed annually) or $36 per month (billed monthly). This plan comes with data modeling and unlimited saved reports features. See full pricing here.
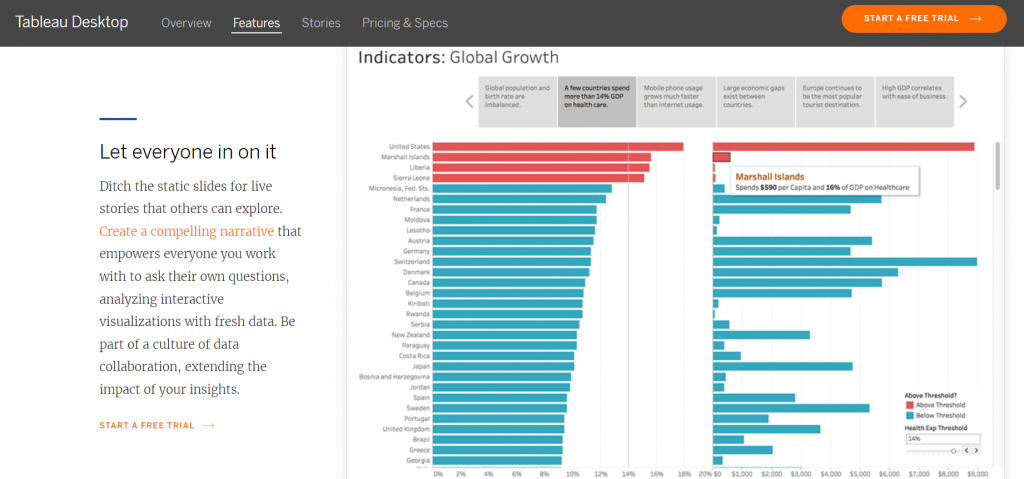
8. Tableau
Best suited for: companies that heavily rely on Microsoft Excel to store data and need to build dashboards based on Excel spreadsheets
Starting price: from $15/month
Key features
Tableau is a powerful business intelligence and data visualization software to create interactive visual analytics in the form of dashboards in real-time.
Firstly, Tableau offers extensive functionality for designing visualizations and dashboards. Dashboards can be developed interactively using the drag and drop function and it runs effectively across different devices.
Tableau can handle massive amounts of data with ease – a million rows of data can be visualized without impacting the overall speed of the dashboard. Pulling data from simple CSV files, PDFs, and spreadsheets to complex Databases like Oracle and Data Warehouses can be done with Tableau.
Some noteworthy Tableau features are:
- Convenient collaboration and sharing options
- Advanced chart types
- Mobile accessibility
- Predictive analysis
- Query translation into analytics
- Role-based permissions
Pricing
Tableau pricing starts from $15/month and this plan comes with PDF/JPG dashboard download and alert functionalities. See full pricing here.
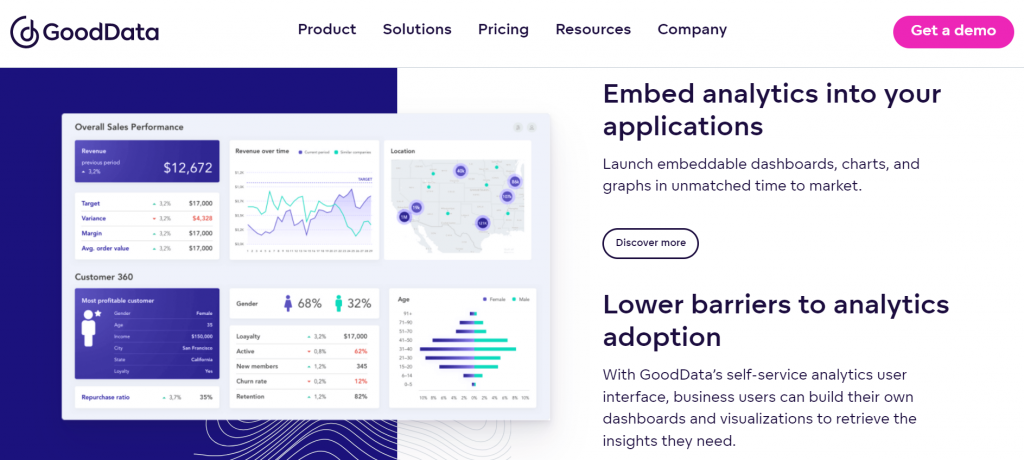
9. GoodData
Best suited for: mid-sized to large businesses that need feature-rich data analytics and reporting solution with embedding and the white-labeling features
Starting price: unknown
Key features
GoodData is a business intelligence and analytics software that offers data management, reporting, and dashboard solutions for businesses.
This software focuses on visualizing data from any resource, including Google Analytics, data warehouse, CRM, CSV files, and many more. Additionally, GoodData provides excellent charts and drill-down analysis, making large complex data sets simplified and easy to understand and interpret.
GoodData is easy-to-use software. You don't need to have extensive knowledge of the product to build attractive dashboards. Its dashboards are optimized for desktop, tablet, and mobile, and can be easily distributed via access rights, scheduled emails, and file exports.
Other GoodData features are:
- Multi-data source reporting
- Reporting sharing
- Predictive analytics
- Drill-down analysis
- White-labeling
- Access management
Pricing
GoodData doesn’t provide pricing information on its website but you can request a demo here. You can sign up for the free version here.
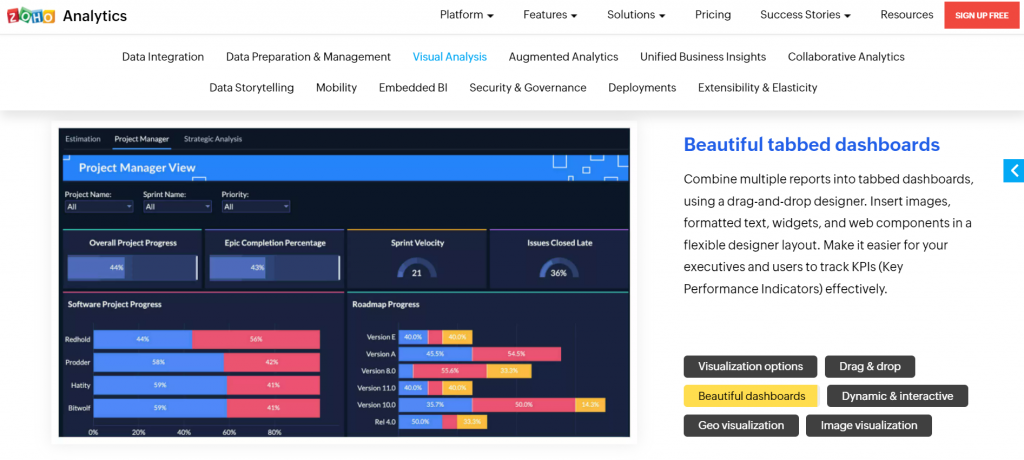
10. Zoho Analytics
Best suited for: marketing, sales, support, and finance teams needing an easy-to-run and budget-friendly analytics solution to discover the hidden meaningful insights out of data
Starting price: from $24/month
Key features
Zoho Analytics is a business intelligence and analytics platform to analyze business data and build insightful reports and dashboards to easily drive informed decision-making.
Zoho Analytics allows you to integrate with over 250 data sources, including Google Analytics, Hubspot, Salesforce, Facebook ads, and many more. Some of the file formats that it also supports are CSV, XLS, XLSX, JSON, and XML.
Its conversational analytics capability lets you engage in conversations with ‘Ask Zia’, and get relevant reports as answers. Furthermore, its what-if analysis feature is great for simulating complex scenarios and uncovering optimal business outcomes. Lastly, have full control over what your teammates or clients can see and do with the data and reports you share with them.
Some essential Zoho Analytics features are:
- Embedded BI
- Unified business insights
- Data preparation
- Access control
- Mobile app
Pricing
Its on-premise version is free to use while the cloud-hosted one is paid and starts from $24/month. See full pricing here.
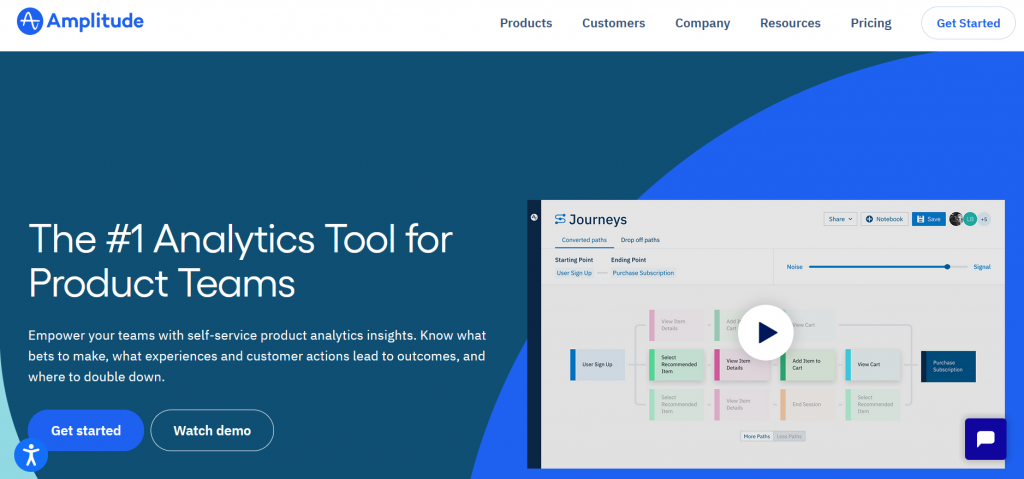
11. Amplitude Analytics
Best suited for: product teams and marketers who need to see the full customer lifecycle, measure user engagement and optimize product experiences
Starting price: unknown
Key features
Amplitude Analytics is a behavior tracking and analytics software designed to meet modern-day product teams' requirements and make data-backed decisions.
It’s a great solution to go beyond surface-level behavioral information like page views and clicks to analyze user behaviors through its interactive dashboards. With Amplitude Analytics, it’s easy to understand the context and intent behind every action and uncover why customers are or aren’t reaching the desired outcomes.
Moreover, Amplitude Analytics is powered by a machine learning algorithm that allows for forecasting behavior patterns over time so you can estimate trends, and use them to inform your goals.
Pricing
Amplitude’s free plan includes unlimited data retention and tracking of up to 10 million actions per month. The pricing information isn’t available on its website. You can sign up here.
Final thoughts
Finding the right KPI tool is no small achievement, and it can be the key to your reporting productivity. To help you out and cut down that wasted research time, I’ve reviewed a list of the 11 free KPI tools above. Bookmark this article so you never must Google ‘free KPI dashboard software’ ever again. Is your favorite KPI tool missing from my list? Let me know in the comments section below.