You often face the challenge of pulling data from multiple sources and visualizing it to find insights. The solution? Dashboard software.
Problem is, beyond the ready-made templates, many of them are actually pretty difficult to customize.
If you're looking for something specific, and you require custom metrics or custom dashboard design, you're in the right place.
In this article, I'll review the 10 powerful and reliable custom dashboard software and their key customization options.
Here are the 10 best custom dashboard software
- Databox
- Klipfolio
- ClicData
- Bold BI
- Sisense
- Microsoft Power BI
- Domo
- Dundas BI
- Grow
- Grafana
1. Databox
Best suited for: KPI dashboards with custom metrics, calculations, and design
Free trial: yes, 14 days. Sign up here.
Starting price: offers a free plan. Paid plans start from $72/month
Key features
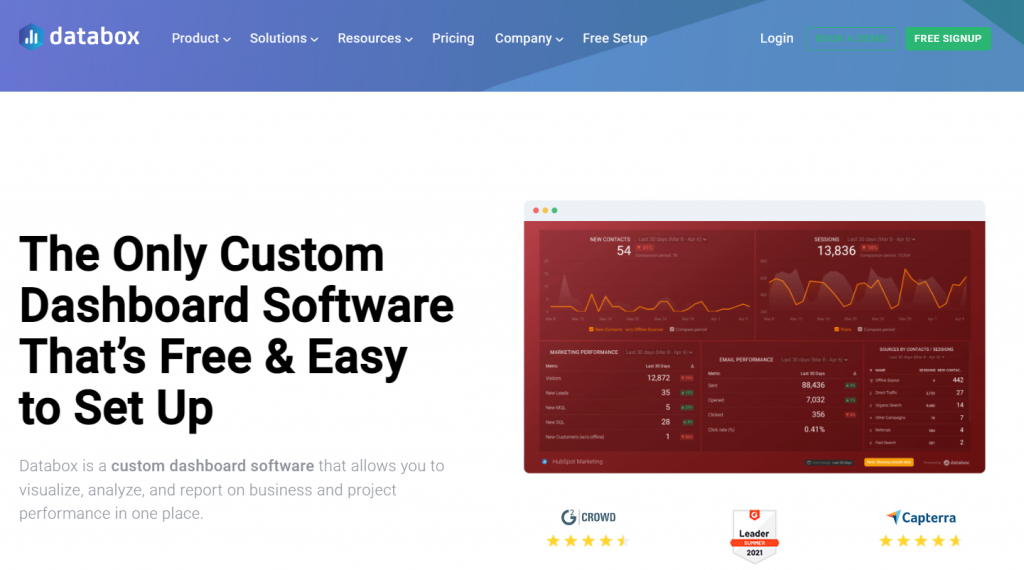
Databox is a custom dashboard and analytics solution to create dashboards & monitor KPIs. Databox has extensive integrations, connecting with over 70 applications and tools.
Databox has many customizable features. For example, you can calculate your own custom metrics:

And with advanced fields like granularity, format, and scale, you have complete control over how your data is presented on your dashboard. Databox dashboards are dynamic, so anytime you resize a visual, the rest of your dashboard adjusts automatically.
Another example: to better visualize the data's meaning, you can customize the % change color for any metric (for example, use green for revenue % increase and red for revenue % decrease).
Possibly the best part — Databox offer all new users free setup assistance for their first dashboard(s). Plus, their success/support teams are generally proactive even beyond the beginning.
Pricing
Databox has a free-forever plan for up to 3 dashboards. The paid plans start from $72 per month (paid annually), and this plan comes with 4 dashboards, access to 5 users, and 11 months of historical data. See full pricing here.
2. Klipfolio
Best suited for: marketing and advertising teams looking to get a holistic understanding of all the data points and create dashboards
Free trial: yes, 14 days. Sign up here.
Starting price: from $99/month
Key features
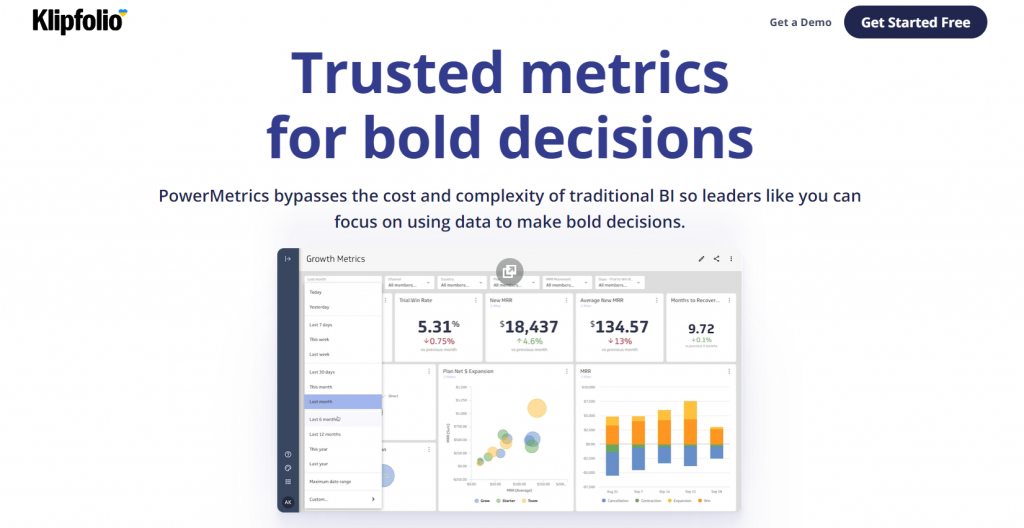
Klipfolio is a business dashboard and analytics software to bring all your data together in one place and create reports. Klipfolio has pre-built connections to over 100 services, or you can upload spreadsheets or retrieve data using SQL and REST queries.
Firstly, from background colors to menu style to how your dashboards load, you can fully rebuild the look and feel of your dashboards. Add colors to your charts and customize colors for specific segments (e.g., use red for Japan or yellow for Spain) to highlight important insights or align with your company branding.
Secondly, in some cases, you may want to measure more than universal metrics. The good thing is that Klipfolio allows you to create your own custom metrics that are based on the fields from your data sources or other custom metrics.
Collaborating via Klipfolio is so practical. You can share your dashboards with individual team members or departments by creating groups, assigning roles, or granting specific access rights.
Pricing
Klipfolio offers 4 plans which are Free, Plus, Pro, and Custom. All plans, including free, come with no limits on users and dashboards. View full pricing here.
3. ClicData
Best suited for: mid-sized companies who need to transform raw data into insights quickly and share dashboards automatically
Free trial: yes, 15 days. Sign up here.
Starting price: from $73/month
Key features
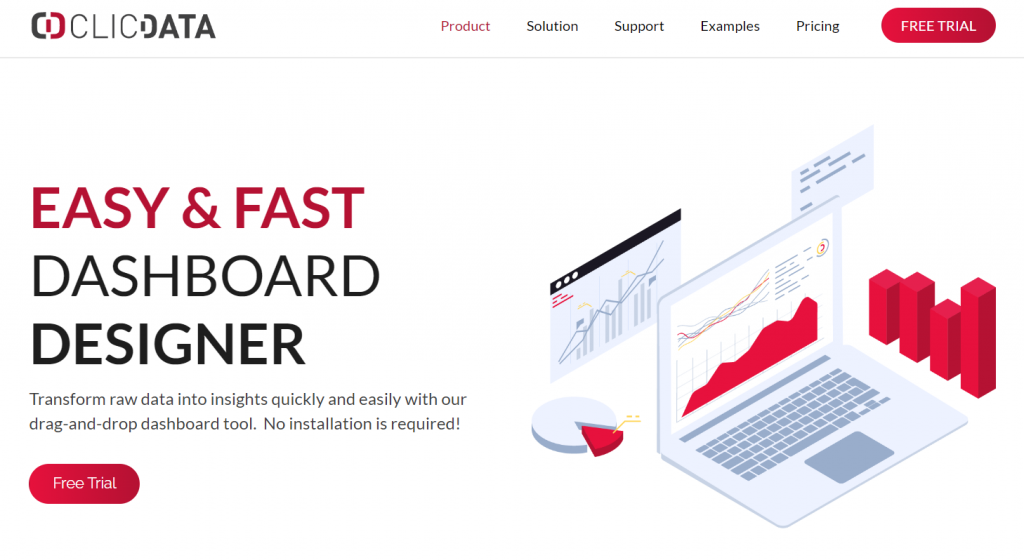
ClicData is business analytics and dashboard software to transform data into dashboards and actionable reports.
All ClicData dashboards are interactive: add drill-down interactions to your charts, indicators, and tables and display sub-tables. Zoom in and out of charts, move time scales, and group by months, quarters, and years.
Integrate ClicData's dashboards into your own application, blog, or website, or white label your ClicData reports for a seamless customer experience.
Another great thing is that you can customize dashboards with additional CSS knowledge. Using CSS, you can change the style of your dashboard and some functional elements.
Pricing
ClicData has 4 plans to choose from which are Personal, Team, Business, and Enterprise. The Personal plan costs $73 per month (billed annually), and 5 users are included in that plan, with no limit on dashboards. See full pricing here.
4. Bold BI
Best suited for: businesses needing a data visualization solution with powerful data connectivity and collaboration features
Free trial: yes, 15 days. Sign up here.
Starting price: from $495/month
Key features
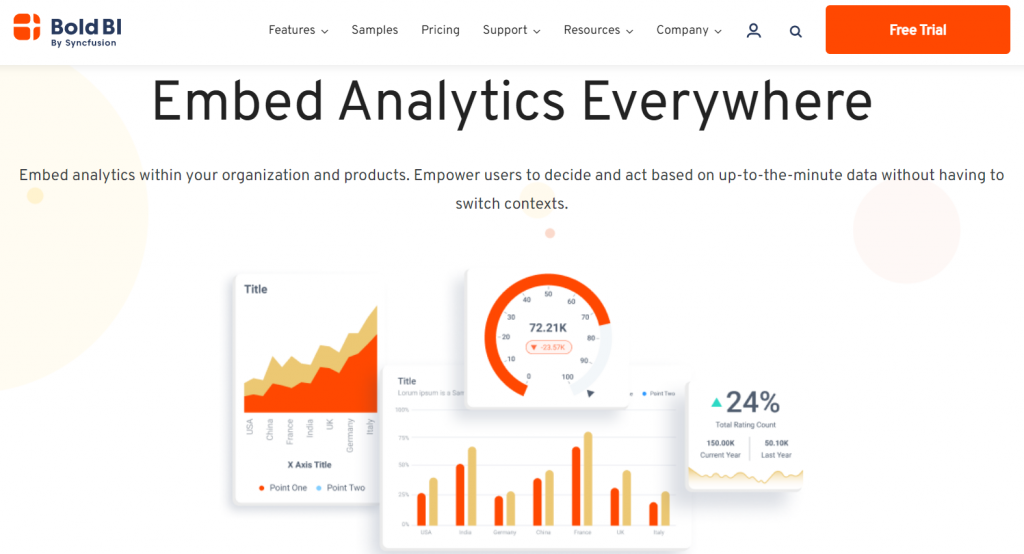
Bold BI is business intelligence software to create and share interactive analytical dashboards. Over 130 data sources are supported, ranging from files and databases to REST API sources.
Bold BI has a powerful customization system that enables the creation of a visualization interface that will offer a user experience that is tailor-made for users. The custom branding feature of Bold BI allows you to customize your dashboard site with your company name, and its header logo, favicon, email header logo, time zone, and date-time display formats.
Additionally, you can set up a custom domain. By default, your dashboards are on the boldbi.com domain, but you can easily replace them with a custom link on a domain that you own like yourbrand.boldbi.com.
Pricing
Bold BI offers 3 plans which are Cloud, Standard, and Plus. The Cloud plan starts from $495 per month with no limit on users and dashboards, on top of custom domain and branding. See full pricing here.
5. Sisense
Best suited for: organizations needing a reporting and dashboard solution with predictive analytics and machine-learning capabilities
Free trial: yes. Sign up here.
Starting price: unknown
Key features
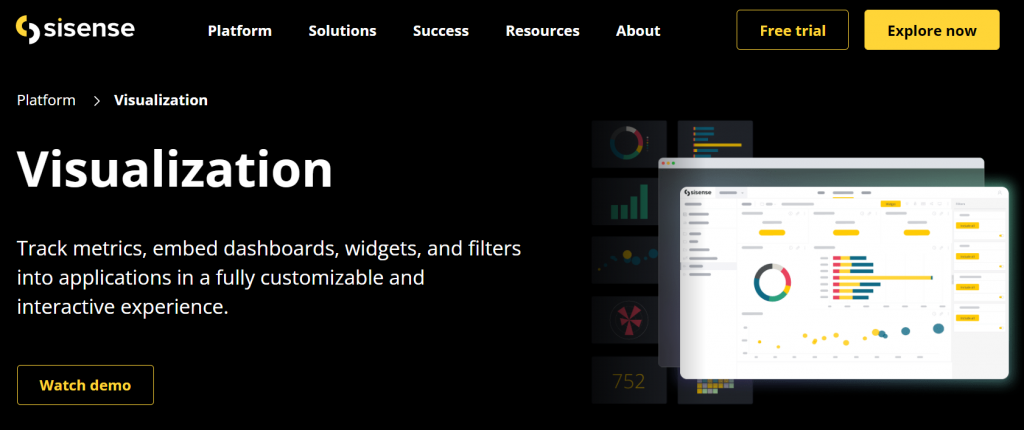
Sisense is AI-powered business intelligence software to analyze data, provide visual analytics, and deliver insights. Whether your data sits in a business application, stored in a database, or cloud data warehouse, Sisense allows you to connect all of your data, thanks to its over 100 connectors.
Regarding Sisense customization, the options include typography, background color, themes, dashboard style, widget header style, and widget design settings.
Sisense’s dashboard layouts are fully customizable: just drag widgets one on top of another by selecting the widget's title and moving the widget to the relevant location. Also, it’s possible to rearrange the order of the widgets, reorganize the widgets in columns, add or remove widgets from columns, and resize dashboard columns.
Pricing
Sisense’s pricing info isn’t available. You can get pricing here.
6. Microsoft Power BI
Best suited for: businesses of all sizes needing a custom dashboard software that offers reliable connection to data sources
Free trial: yes. Sign up here.
Starting price: Desktop version is FREE. Paid plans start from $13.70/user/month
Key features
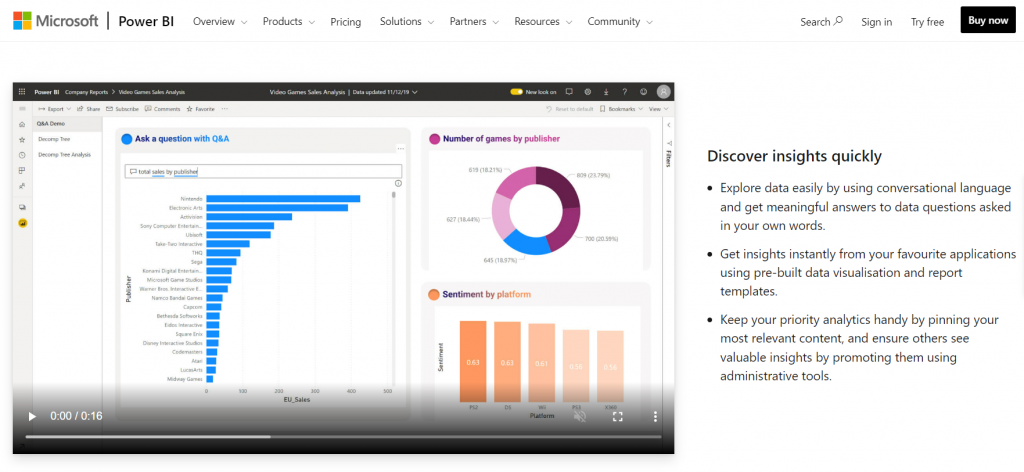
Microsoft Power BI is a data analytics and reporting tool to aggregate, analyze, and visualize data for different use cases. Power BI data sources are extensive as you can connect with over 500 business applications in a few clicks.
With a large collection of data visualizations, you can begin visualizing your data in seconds. That being said, you can also tailor custom data visualizations to your requirements or industry to differentiate your organization and develop something unique.
You can use dashboard themes to apply a color scheme, such as corporate colors, to your whole dashboard. Another option to create a custom theme is to upload a JSON file with settings for all the colors you wish to use for your dashboards.
Another advanced Power BI feature is that with the help of its developer tools, every web developer can code, test, and package new visuals directly in the Power BI service to be added to the gallery.
Pricing
Power BI’s desktop version is free to use which you can download here. Paid plans start from $13.70/user/month which comes with mobile app access and a connection with more than 100 data sources. View full pricing here.
7. Domo
Best suited for: midsize to large organizations looking for a low-code data app platform to create dashboards
Free trial: yes. Sign up here.
Starting price: unknown
Key features
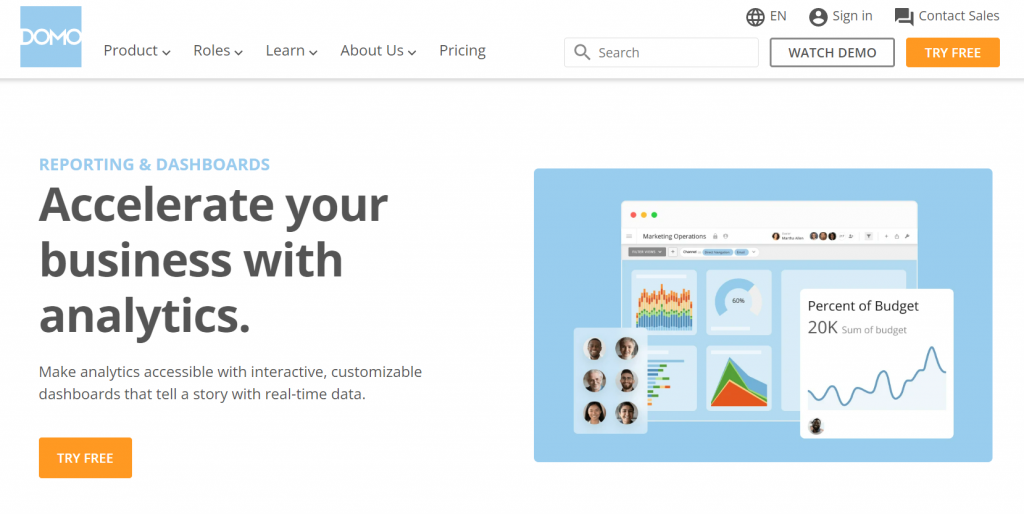
Domo is business analytics and dashboard solution to transform raw data into interactive reports and dashboards. It supports over 1000 pre-built connectors and many other ways to extract your data.
All Domo dashboards are customizable. For ultimate flexibility in colors, filters, and charts, you can modify visualizations as per your needs, so you’re in complete charge of how your information is seen with customizable dashboard layouts.
Additionally, Domo allows you to resize or reorder cards to make specific metrics more prominent. It's also great to be able to create the layout you want with drag-and-drop cards, headers, and templates and use in-line notebook cards to deliver commentary about data on the same page.
Pricing
Domo’s pricing information isn’t available on the website. You can contact Domo’s sales team for a personalized quote here.
8. Dundas BI
Best suited for: mid-to-large enterprises who need advanced dashboard capabilities for more personalized reporting and analysis
Free trial: yes, 25 days. Sign up here.
Starting price: unknown
Key features
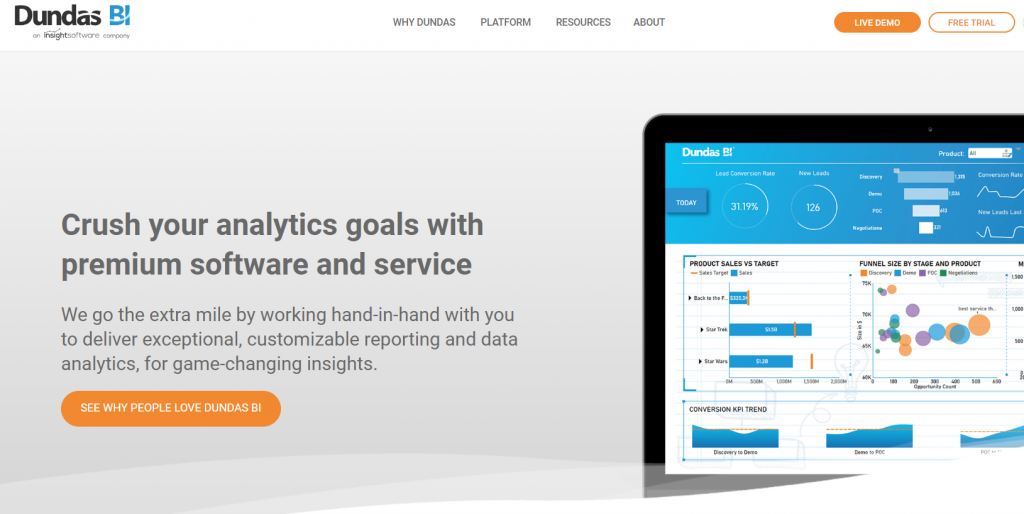
Dundas BI is an enterprise-level business intelligence and dashboard solution to build interactive dashboards, reports, and scorecards. This software takes care of all your business intelligence and data analytics needs from within a single, central location.
Firstly, Dundas BI offers limitless customization. You can easily add data visualizations or components on the dashboard and arrange them anywhere on the canvas. Dashboards allow you to filter, sort, group, drill down, and apply advanced calculations through an easy-to-use interface.
Furthermore, every element you see on your dashboards can be customized, including data visualizations, interactions, scorecards, and labels.
Another noteworthy point about Dundas BI is that you can consolidate and store data from any source, providing seamless data delivery and a consistent user experience.
Pricing
Dundas BI pricing info isn’t available on the website. You can get a pricing quote here.
9. Grow
Best suited for: businesses who need one platform to power data analytics and business dashboards needs
Free trial: yes. Sign up here.
Starting price: unknown
Key features
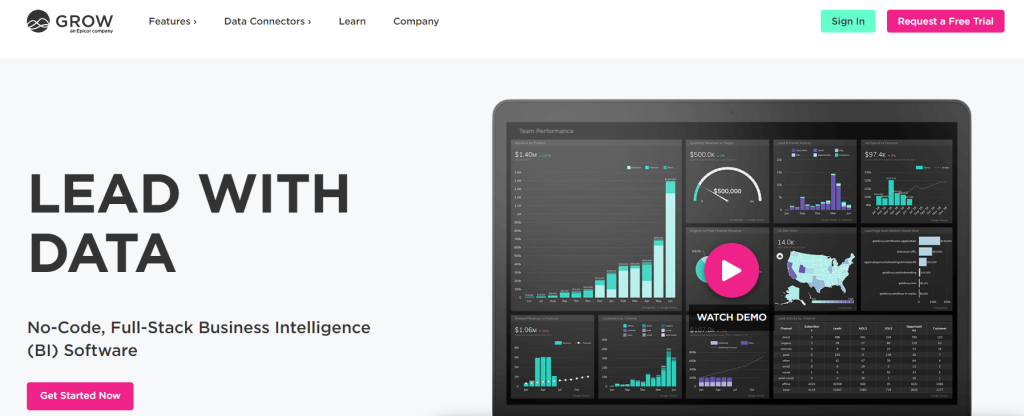
Grow is full-stack business analytics and dashboard software to explore data and build visualizations. You can easily combine several data sources, filter them, and experiment with various visualizations as you explore your data to uncover crucial business insights.
Some important Grow features are individual metric filtering, drilling, and the historical state of metric data based on previous run times.
Grow dashboards are fully customizable: show your logo, add your own favicon, access Grow dashboards through your own URL, and configure your own email system to deliver branded emails from your domain automatically. Besides those, Grow lets you choose a unique color scheme to ensure that all of your KPI visualizations reflect your brand colors.
Pricing
The pricing info isn’t available. You can contact Grow sales team here.
10. Grafana
Best suited for: companies looking for an open-source custom dashboard software
Free trial: yes, 24 days. Sign up here.
Starting price: offers a FREE version. Download here.
Key features
Grafana is open-source analytics and dashboard software to create and share beautiful dashboards that combine data from different sources. Take any of your existing data from cloud services or even Google Sheets, and visualize it the way you want, all from a single dashboard.
Grafana’s custom branding allows you to replace the Grafana brand and logo with your own corporate brand and logo. You can change the following elements: application title, login background, side menu top logo, footer and help menu links, favicon (shown in the browser tab), login title, and many more.
Pricing
Grafana’s free plan is for up to 3 users. The Pro plan starts from $8 per month that comes with query caching and reporting capabilities. View full pricing here.
